

Aug 17: Updated, as there was a significant number of pending long-term MVP renewals. I guess these things can happen when people need to accept their renewal during vacation.
Another year, another Microsoft MVP award cycle. And a new program logo, if you spotted it. This year, this post took a while longer to get published. This is due to the date the renewals were announced, as well as the vacation period, which may have delayed people from confirming their renewal agreement.
The numbers below are from the public MVP portal as of July 31st. The yearly MVP renewal period is a good time to take a quick look at the MVP population. Comparing them to the end of July from recent years should give an idea of trends and which award categories and technologies are in focus.
Some observations:
- 3.681 public MVP profiles were processed. The overall number stayed roughly the same compared to last year. However, compared to the number of MVPs at the end of June, the number fell by 13% (was 4.193).
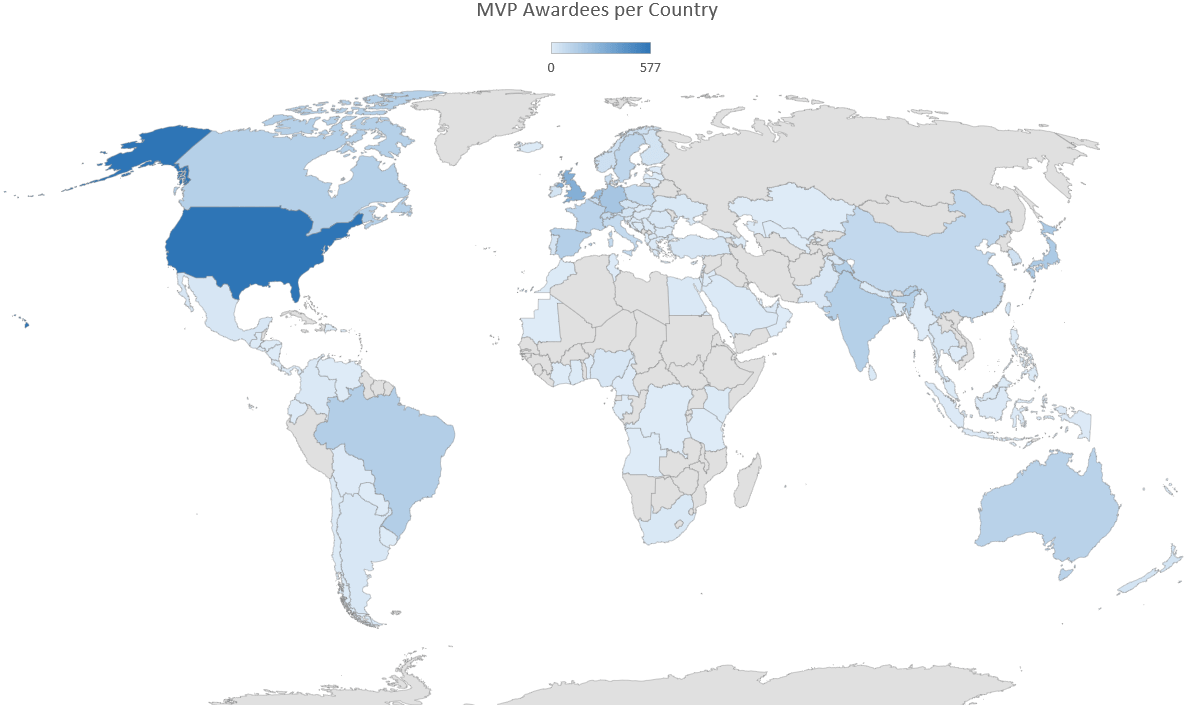
- US remains a dominant location (577). Looking at representation relative to its population, Denmark, Norway, and Sweden remain strong, while India is underrepresented (134).
- China saw a sharp decline in absolute (-42) and relative (-32%) numbers.
- Again, some minor category shuffling took place, as Microsoft Foundry replaced AI Platform.
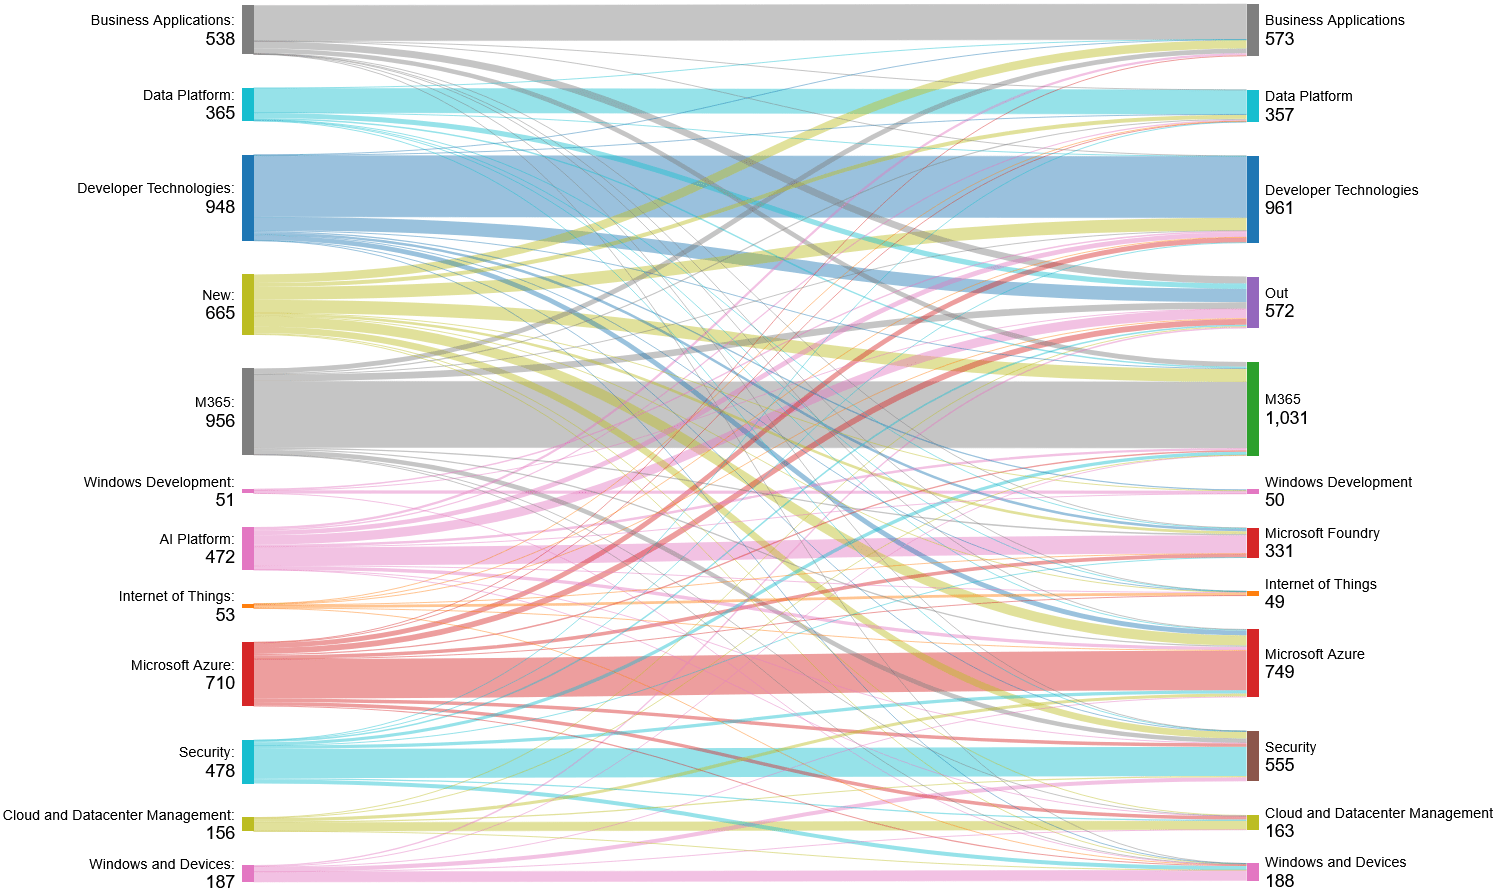
- See the Sankey diagram further down this article to see where new awardees entered, awardees moved between categories, or who exited the program.
- While 4 new countries are represented (Cyprus, Mauritania, New Caledonia, Tunisia), 4 countries lost theirs (Benin, Myanmar, Oman, Tanzania).
- Emerging growth in non-Western areas, e.g., Saudi Arabia (+125%), Vietnam (+100%), UAE (+100%), Honduras (+100%), Guatemala (+67%), El Salvador (+50%), Egypt (+40%), North Macedonia (+38%), Thailand (+35%).
- The number of MVPs with more than one award category has increased by 15%.
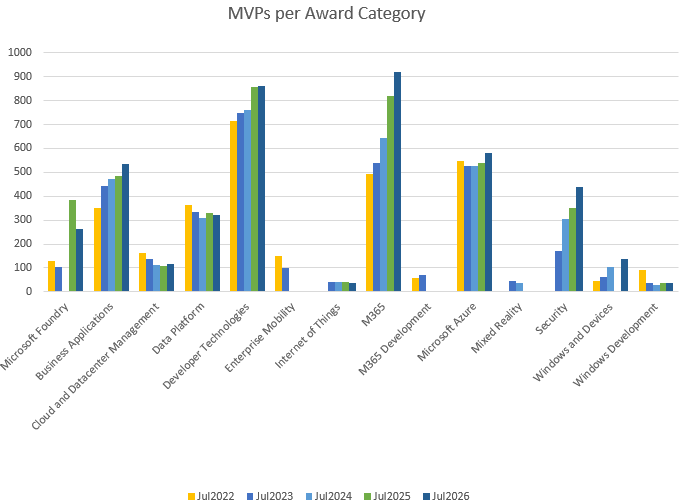
- The MVP award category with the most MVPs is now M365 (was Developer Technologies).
MVP Awardees per Category
The following chart and table show awardees per category from 2021 to 2025, plus change percentages compared to previous years.
| Category | Jul’22 | % | Jul’23 | % | Jul’24 | % | Jul’25 | % | Jul’26 | % |
|---|---|---|---|---|---|---|---|---|---|---|
| Microsoft Foundry | 128 | -7% | 105.0 | -18% | – | -100% | 386 | 0% | 263 | -32% |
| Business Applications | 351 | 9% | 442.0 | 26% | 474.0 | 7% | 483 | 2% | 533 | 10% |
| Cloud and Datacenter Management | 164 | -25% | 136.0 | -17% | 111.0 | -18% | 106 | -5% | 117 | 10% |
| Data Platform | 364 | -7% | 335.0 | -8% | 307.0 | -8% | 329 | 7% | 320 | -3% |
| Developer Technologies | 715 | -7% | 747 | 4% | 761 | 2% | 859 | 13% | 862 | 0% |
| Enterprise Mobility | 149 | 12% | 100 | -33% | – | -100% | – | 0% | – | 0% |
| Internet of Things | – | 0% | 43 | 0% | 43 | 0% | 39 | -9% | 35 | -10% |
| M365 | 492 | -12% | 541 | 10% | 643 | 19% | 819 | 27% | 922 | 13% |
| M365 Development | 59 | -14% | 70 | 19% | – | -100% | – | 0% | – | 0% |
| Microsoft Azure | 546 | 2% | 526 | -4% | 527 | 0% | 539 | 2% | 583 | 8% |
| Mixed Reality | – | 0% | 45 | 0% | 35 | -22% | – | -100% | – | 0% |
| Security | – | 0% | 171 | 0% | 305 | 78% | 349 | 14% | 438 | 26% |
| Windows and Devices | 45 | 7% | 61 | 36% | 102 | 67% | – | -100% | 137 | 0% |
| Windows Development | 92 | -23% | 37 | -60% | 30 | -19% | 35 | 17% | 35 | 0% |
| Total Categories | 3,105 | -6% | 3,359 | 8% | 3,338 | -1% | 3,944 | 18% | 4,245 | 8% |
| Total MVPs | 3,023 | -6% | 3,175 | 5% | 3,187 | 0% | 3,589 | 13% | 3,681 | 3% |
Note: The difference between Total Categories and Total MVPs is caused by MVPs awarded in more than one category.
Where did they go?
The Sankey diagram below displays the number of awarded categories moving from last year to now. The move is based on the MVP, the categories they had, and the new categories they have currently been awarded in, which can be multiple. New awardees are categorized as New, and those who were not renewed are categorized as Out.
MVP Awardees per Country
The following chart and table display the awardees per country, plus change percentages compared to July last year. Countries that show a 0 no longer have any MVP. “Fun facts,” such as MVP’s per 1M population and area, are based on data provided by countries.dev.
| Country | WAS (2025) | NOW (2026) | Change PERCENTAGE | MVPs per 1M ppl | MVPs per 1,000 km^2 |
|---|---|---|---|---|---|
| Albania | 1 | 1 | 0% | 0.35 | 0.03 |
| Angola | 1 | 1 | 0% | 0.03 | 0.00 |
| Argentina | 19 | 20 | 5% | 0.44 | 0.01 |
| Australia | 113 | 121 | 7% | 4.71 | 0.02 |
| Austria | 37 | 39 | 5% | 4.37 | 0.46 |
| Azerbaijan | 3 | 2 | -33% | 0.20 | 0.02 |
| Bahrain | 2 | 2 | 0% | 1.18 | 2.61 |
| Bangladesh | 1 | 1 | 0% | 0.01 | 0.01 |
| Belgium | 64 | 68 | 6% | 5.88 | 2.23 |
| Benin | 1 | 0 | -100% | – | – |
| Bolivia | 5 | 4 | -20% | 0.34 | 0.00 |
| Bosnia and Herzegovina | 6 | 5 | -17% | 1.52 | 0.10 |
| Brazil | 139 | 141 | 1% | 0.66 | 0.02 |
| Bulgaria | 8 | 10 | 25% | 1.44 | 0.09 |
| Cambodia | 1 | 1 | 0% | 0.06 | 0.01 |
| Cameroon | 3 | 4 | 33% | 0.15 | 0.01 |
| Canada | 130 | 133 | 2% | 3.50 | 0.01 |
| Chile | 5 | 5 | 0% | 0.26 | 0.01 |
| China | 134 | 92 | -31% | 0.07 | 0.01 |
| Colombia | 14 | 14 | 0% | 0.28 | 0.01 |
| Congo (DRC) | 1 | 1 | 0% | 0.01 | 0.00 |
| Costa Rica | 2 | 2 | 0% | 0.39 | 0.04 |
| Côte d’Ivoire | 1 | 1 | 0% | 0.04 | 0.00 |
| Croatia | 11 | 10 | -9% | 2.47 | 0.18 |
| Cyprus | 0 | 2 | 100% | 1.66 | 0.22 |
| Czechia | 31 | 35 | 13% | 3.27 | 0.44 |
| Denmark | 63 | 69 | 10% | 11.83 | 1.60 |
| Dominican Republic | 6 | 5 | -17% | 0.46 | 0.10 |
| Ecuador | 4 | 4 | 0% | 0.23 | 0.01 |
| Egypt | 10 | 14 | 40% | 0.14 | 0.01 |
| El Salvador | 2 | 3 | 50% | 0.46 | 0.14 |
| Estonia | 4 | 3 | -25% | 2.25 | 0.07 |
| Finland | 39 | 40 | 3% | 7.23 | 0.12 |
| France | 114 | 116 | 2% | 1.72 | 0.18 |
| Gabon | 1 | 1 | 0% | 0.45 | 0.00 |
| Georgia | 2 | 2 | 0% | 0.54 | 0.03 |
| Germany | 179 | 184 | 3% | 2.21 | 0.52 |
| Ghana | 6 | 6 | 0% | 0.19 | 0.03 |
| Greece | 10 | 10 | 0% | 0.93 | 0.08 |
| Guatemala | 3 | 5 | 67% | 0.30 | 0.05 |
| Honduras | 1 | 2 | 100% | 0.20 | 0.02 |
| Hong Kong SAR | 7 | 9 | 29% | 1.20 | 8.15 |
| Hungary | 6 | 8 | 33% | 0.82 | 0.09 |
| Iceland | 6 | 5 | -17% | 13.65 | 0.05 |
| India | 148 | 134 | -9% | 0.10 | 0.04 |
| Indonesia | 9 | 8 | -11% | 0.03 | 0.00 |
| Ireland | 32 | 33 | 3% | 6.61 | 0.47 |
| Israel | 17 | 15 | -12% | 1.63 | 0.72 |
| Italy | 76 | 84 | 11% | 1.41 | 0.28 |
| Japan | 164 | 163 | -1% | 1.30 | 0.43 |
| Jordan | 1 | 1 | 0% | 0.10 | 0.01 |
| Kazakhstan | 1 | 1 | 0% | 0.05 | 0.00 |
| Kenya | 8 | 7 | -13% | 0.13 | 0.01 |
| Korea | 59 | 49 | -17% | 0.95 | 0.49 |
| Latvia | 3 | 2 | -33% | 1.05 | 0.03 |
| Lebanon | 1 | 1 | 0% | 0.15 | 0.10 |
| Lithuania | 5 | 3 | -40% | 1.07 | 0.05 |
| Luxembourg | 2 | 2 | 0% | 3.16 | 0.77 |
| Malaysia | 5 | 6 | 20% | 0.19 | 0.02 |
| Malta | 3 | 4 | 33% | 7.61 | 12.66 |
| Mauritania | 0 | 1 | 100% | 0.22 | 0.00 |
| Mauritius | 2 | 2 | 0% | 1.58 | 0.98 |
| Mexico | 21 | 23 | 10% | 0.18 | 0.01 |
| Morocco | 7 | 6 | -14% | 0.16 | 0.01 |
| Myanmar | 1 | 0 | -100% | – | – |
| Nepal | 5 | 6 | 20% | 0.21 | 0.04 |
| Netherlands | 197 | 224 | 14% | 12.84 | 5.35 |
| New Caledonia | 0 | 1 | 100% | 3.68 | 0.05 |
| New Zealand | 35 | 36 | 3% | 7.08 | 0.13 |
| Nicaragua | 2 | 2 | 0% | 0.30 | 0.02 |
| Nigeria | 23 | 24 | 4% | 0.12 | 0.03 |
| North Macedonia | 8 | 11 | 38% | 5.28 | 0.43 |
| Norway | 52 | 57 | 10% | 10.60 | 0.18 |
| Oman | 1 | 0 | -100% | – | – |
| Pakistan | 15 | 17 | 13% | 0.08 | 0.02 |
| Panama | 1 | 1 | 0% | 0.23 | 0.01 |
| Paraguay | 1 | 1 | 0% | 0.14 | 0.00 |
| Peru | 15 | 17 | 13% | 0.52 | 0.01 |
| Philippines | 6 | 7 | 17% | 0.06 | 0.02 |
| Poland | 73 | 74 | 1% | 1.95 | 0.24 |
| Portugal | 25 | 28 | 12% | 2.72 | – |
| Puerto Rico | 1 | 1 | 0% | 0.31 | 0.11 |
| Qatar | 1 | 1 | 0% | 0.35 | 0.09 |
| Romania | 19 | 19 | 0% | 0.99 | 0.08 |
| Saudi Arabia | 4 | 9 | 125% | 0.26 | 0.00 |
| Serbia | 10 | 11 | 10% | 1.59 | 0.12 |
| Singapore | 23 | 30 | 30% | 5.28 | 42.25 |
| Slovakia | 5 | 5 | 0% | 0.92 | 0.10 |
| Slovenia | 7 | 9 | 29% | 4.29 | 0.44 |
| South Africa | 14 | 15 | 7% | 0.25 | 0.01 |
| Spain | 124 | 137 | 10% | 2.89 | 0.27 |
| Sri Lanka | 10 | 12 | 20% | 0.55 | 0.18 |
| Sweden | 98 | 102 | 4% | 9.85 | 0.23 |
| Switzerland | 66 | 80 | 21% | 9.26 | 1.94 |
| Taiwan | 46 | 38 | -17% | 1.62 | 1.05 |
| Tanzania | 1 | 0 | -100% | – | – |
| Thailand | 17 | 23 | 35% | 0.33 | 0.04 |
| Tunisia | 0 | 4 | 100% | 0.34 | 0.02 |
| Türkiye | 24 | 23 | -4% | 0.27 | 0.03 |
| Ukraine | 16 | 16 | 0% | 0.36 | 0.03 |
| United Arab Emirates | 4 | 8 | 100% | 0.81 | 0.10 |
| United Kingdom | 306 | 294 | -4% | 4.37 | 1.21 |
| United States | 563 | 577 | 2% | 1.75 | 0.06 |
| Uruguay | 2 | 2 | 0% | 0.58 | 0.01 |
| Uzbekistan | 1 | 1 | 0% | 0.03 | 0.00 |
| Venezuela | 1 | 1 | 0% | 0.04 | 0.00 |
| Vietnam | 5 | 10 | 100% | 0.10 | 0.03 |
| Yemen | 1 | 1 | 0% | 0.03 | 0.00 |
If you have questions or comments, please leave them in the comments below.
You must be logged in to post a comment.