
MVPs around the World (2026)

Aug 17: Updated, as there was a significant number of pending long-term MVP renewals. I guess these things can happen when people need to accept their renewal during vacation.

Another year, another Microsoft MVP award cycle. And a new program logo, if you spotted it. This year, this post took a while longer to get published. This is due to the date the renewals were announced, as well as the vacation period, which may have delayed people from confirming their renewal agreement.

The numbers below are from the public MVP portal as of July 31st. The yearly MVP renewal period is a good time to take a quick look at the MVP population. Comparing them to the end of July from recent years should give an idea of trends and which award categories and technologies are in focus.

Some observations:

  • 3.681 public MVP profiles were processed. The overall number stayed roughly the same compared to last year. However, compared to the number of MVPs at the end of June, the number fell by 13% (was 4.193).
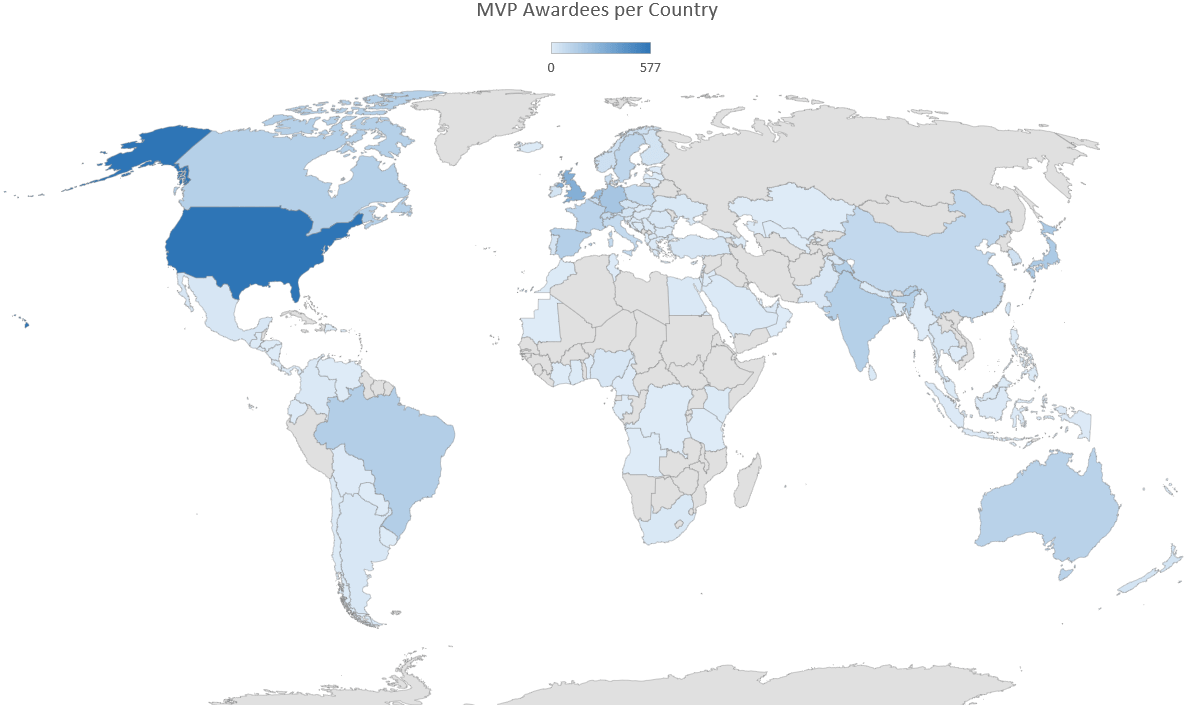
  • US remains a dominant location (577). Looking at representation relative to its population, Denmark, Norway, and Sweden remain strong, while India is underrepresented (134).
  • China saw a sharp decline in absolute (-42) and relative (-32%) numbers.
  • Again, some minor category shuffling took place, as Microsoft Foundry replaced AI Platform.
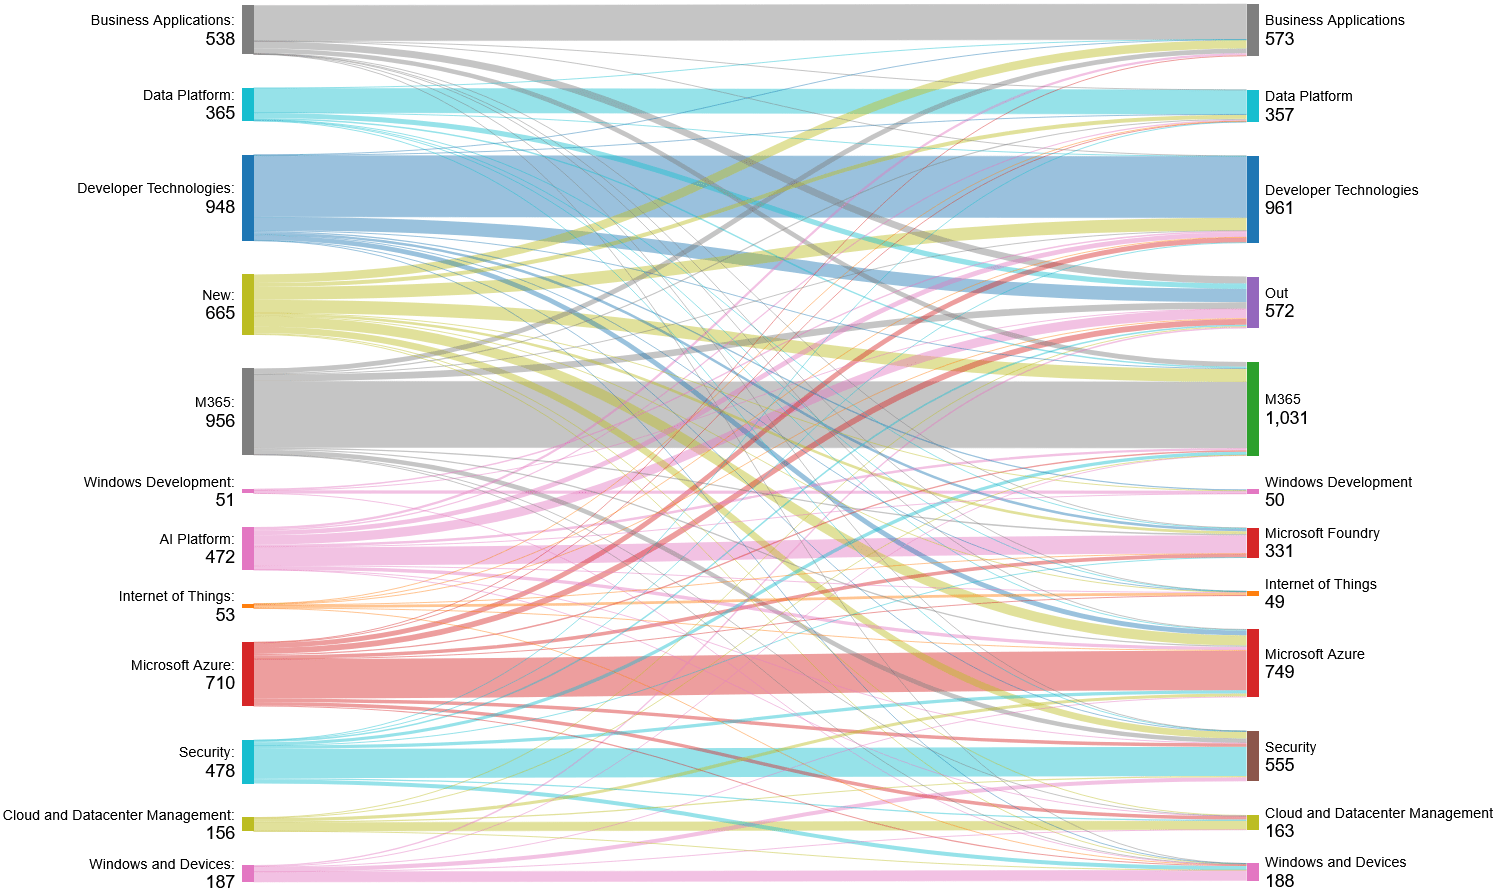
  • See the Sankey diagram further down this article to see where new awardees entered, awardees moved between categories, or who exited the program.
  • While 4 new countries are represented (Cyprus, Mauritania, New Caledonia, Tunisia), 4 countries lost theirs (Benin, Myanmar, Oman, Tanzania).
  • Emerging growth in non-Western areas, e.g., Saudi Arabia (+125%), Vietnam (+100%), UAE (+100%), Honduras (+100%), Guatemala (+67%), El Salvador (+50%), Egypt (+40%), North Macedonia (+38%), Thailand (+35%).
  • The number of MVPs with more than one award category has increased by 15%.
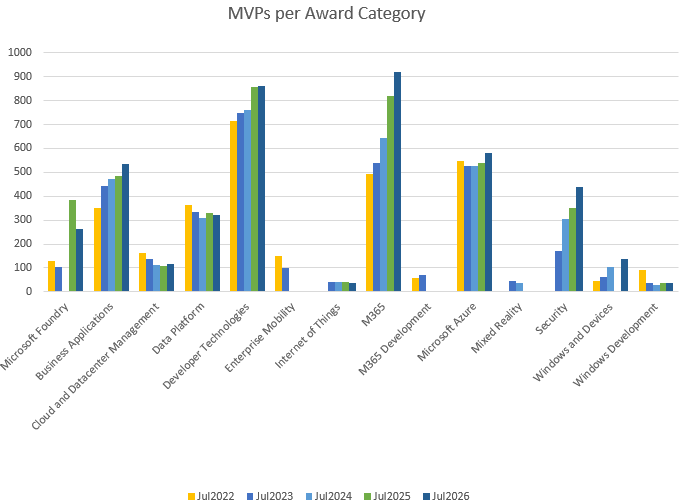
  • The MVP award category with the most MVPs is now M365 (was Developer Technologies).

MVP Awardees per Category

The following chart and table show awardees per category from 2021 to 2025, plus change percentages compared to previous years.
CategoryJul’22%Jul’23%Jul’24%Jul’25%Jul’26%
Microsoft Foundry128-7%105.0-18%-100%3860%263-32%
Business Applications3519%442.026%474.07%4832%53310%
Cloud and Datacenter Management164-25%136.0-17%111.0-18%106-5%11710%
Data Platform364-7%335.0-8%307.0-8%3297%320-3%
Developer Technologies715-7%7474%7612%85913%8620%
Enterprise Mobility14912%100-33%-100%0%0%
Internet of Things0%430%430%39-9%35-10%
M365492-12%54110%64319%81927%92213%
M365 Development59-14%7019%-100%0%0%
Microsoft Azure5462%526-4%5270%5392%5838%
Mixed Reality0%450%35-22%-100%0%
Security0%1710%30578%34914%43826%
Windows and Devices457%6136%10267%-100%1370%
Windows Development92-23%37-60%30-19%3517%350%
Total Categories3,105-6%3,3598%3,338-1%3,94418%4,2458%
Total MVPs3,023-6%3,1755%3,1870%3,58913%3,6813%

Note: The difference between Total Categories and Total MVPs is caused by MVPs awarded in more than one category.

Where did they go?

The Sankey diagram below displays the number of awarded categories moving from last year to now. The move is based on the MVP, the categories they had, and the new categories they have currently been awarded in, which can be multiple. New awardees are categorized as New, and those who were not renewed are categorized as Out.
MVP Awardees per Country

The following chart and table display the awardees per country, plus change percentages compared to July last year. Countries that show a 0 no longer have any MVP. “Fun facts,” such as MVP’s per 1M population and area, are based on data provided by countries.dev.
CountryWAS
(2025)
NOW
(2026)
Change
PERCENTAGE
MVPs per
1M ppl
MVPs per
1,000 km^2
Albania110%             0.35           0.03
Angola110%             0.03           0.00
Argentina19205%             0.44           0.01
Australia1131217%             4.71           0.02
Austria37395%             4.37           0.46
Azerbaijan32-33%             0.20           0.02
Bahrain220%             1.18           2.61
Bangladesh110%             0.01           0.01
Belgium64686%             5.88           2.23
Benin10-100%                –                 –  
Bolivia54-20%             0.34           0.00
Bosnia and Herzegovina65-17%             1.52           0.10
Brazil1391411%             0.66           0.02
Bulgaria81025%             1.44           0.09
Cambodia110%             0.06           0.01
Cameroon3433%             0.15           0.01
Canada1301332%             3.50           0.01
Chile550%             0.26           0.01
China13492-31%             0.07           0.01
Colombia14140%             0.28           0.01
Congo (DRC)110%             0.01           0.00
Costa Rica220%             0.39           0.04
Côte d’Ivoire110%             0.04           0.00
Croatia1110-9%             2.47           0.18
Cyprus02100%             1.66           0.22
Czechia313513%             3.27           0.44
Denmark636910%           11.83           1.60
Dominican Republic65-17%             0.46           0.10
Ecuador440%             0.23           0.01
Egypt101440%             0.14           0.01
El Salvador2350%             0.46           0.14
Estonia43-25%             2.25           0.07
Finland39403%             7.23           0.12
France1141162%             1.72           0.18
Gabon110%             0.45           0.00
Georgia220%             0.54           0.03
Germany1791843%             2.21           0.52
Ghana660%             0.19           0.03
Greece10100%             0.93           0.08
Guatemala3567%             0.30           0.05
Honduras12100%             0.20           0.02
Hong Kong SAR7929%             1.20           8.15
Hungary6833%             0.82           0.09
Iceland65-17%           13.65           0.05
India148134-9%             0.10           0.04
Indonesia98-11%             0.03           0.00
Ireland32333%             6.61           0.47
Israel1715-12%             1.63           0.72
Italy768411%             1.41           0.28
Japan164163-1%             1.30           0.43
Jordan110%             0.10           0.01
Kazakhstan110%             0.05           0.00
Kenya87-13%             0.13           0.01
Korea5949-17%             0.95           0.49
Latvia32-33%             1.05           0.03
Lebanon110%             0.15           0.10
Lithuania53-40%             1.07           0.05
Luxembourg220%             3.16           0.77
Malaysia5620%             0.19           0.02
Malta3433%             7.61         12.66
Mauritania01100%             0.22           0.00
Mauritius220%             1.58           0.98
Mexico212310%             0.18           0.01
Morocco76-14%             0.16           0.01
Myanmar10-100%                –                 –  
Nepal5620%             0.21           0.04
Netherlands19722414%           12.84           5.35
New Caledonia01100%             3.68           0.05
New Zealand35363%             7.08           0.13
Nicaragua220%             0.30           0.02
Nigeria23244%             0.12           0.03
North Macedonia81138%             5.28           0.43
Norway525710%           10.60           0.18
Oman10-100%                –                 –  
Pakistan151713%             0.08           0.02
Panama110%             0.23           0.01
Paraguay110%             0.14           0.00
Peru151713%             0.52           0.01
Philippines6717%             0.06           0.02
Poland73741%             1.95           0.24
Portugal252812%             2.72 –
Puerto Rico110%             0.31           0.11
Qatar110%             0.35           0.09
Romania19190%             0.99           0.08
Saudi Arabia49125%             0.26           0.00
Serbia101110%             1.59           0.12
Singapore233030%             5.28         42.25
Slovakia550%             0.92           0.10
Slovenia7929%             4.29           0.44
South Africa14157%             0.25           0.01
Spain12413710%             2.89           0.27
Sri Lanka101220%             0.55           0.18
Sweden981024%             9.85           0.23
Switzerland668021%             9.26           1.94
Taiwan4638-17%             1.62           1.05
Tanzania10-100%                –                 –  
Thailand172335%             0.33           0.04
Tunisia04100%             0.34           0.02
Türkiye2423-4%             0.27           0.03
Ukraine16160%             0.36           0.03
United Arab Emirates48100%             0.81           0.10
United Kingdom306294-4%             4.37           1.21
United States5635772%             1.75           0.06
Uruguay220%             0.58           0.01
Uzbekistan110%             0.03           0.00
Venezuela110%             0.04           0.00
Vietnam510100%             0.10           0.03
Yemen110%             0.03           0.00

If you have questions or comments, please leave them in the comments below.

MVPs around the World (2025)

31Jul: Moved MVPs per country to bottom and expanded table.

Another year, another Microsoft MVP award cycle. Always a great moment to have a quick peek at the MVP population. Note that this year, this post took a while longer to get published. This is due to the date of awards being announced, as well as the vacation period, which caused delays in people confirming their renewal agreement.

The numbers below are taken from the public MVP portal on July 30th. Comparing them to July from recent years should give an idea of trends and what award categories (and thus products) have focus.

A few notes:

  • 3.589 public MVP profiles were processed. The overall number went up compared to last year. However, compared to the MVPs of June, the overall number went down by 12%.
  • The award category Mixed Reality has been closed. Have a look at the Sankey diagram further down this article to see where these people went.
  • The number of countries represented went down when compared to last year.
  • The number of MVPs with more than one award category has increased by 13%.
  • The MVP award category with the most MVPs is still the Developer Technologies.

MVP Awardees per Category

The following chart and table display the awardees per award category from 2021 to 2025, plus change percentages compared to previous years.

Award CategoryJul2021Jul2022%Jul2023%Jul2024%Jul2025%
AI Platform138128-7%105-18%269156%38643%
Business Applications3233519%44226%4747%4832%
Cloud and Datacenter Management219164-25%136-17%111-18%106-5%
Data Platform392364-7%335-8%307-8%3297%
Developer Technologies770715-7%7474%7612%85913%
Enterprise Mobility13314912%100-33%0-100%00%
Internet of Things000%430%430%39-9%
M365556492-12%54110%64319%81927%
M365 Development6959-14%7019%0-100%00%
Microsoft Azure5345462%526-4%5270%5392%
Mixed Reality000%450%35-22%0-100%
Security000%1710%30578%34914%
Windows and Devices42457%6136%10267%13330%
Windows Development12092-23%37-60%30-19%3517%
Total Categories32963105-6%33598%36077%407713%
Total MVPs32233023-6%31755%31870%358913%

Note: The difference between total categories and total MVPs is caused by MVPs that are awarded in more than one category.

Where did they go?

The Sankey diagram below displays the number of awarded categories moving from last year to now. The move is based on the MVP, the categories they had, and the new categories they have currently been awarded in. New awardees are categorized as “New,” and those who are no longer present on the MVP portal (e.g., no longer MVP) are categorized as “Out.”

MVP Awardees per Country

The following chart and table display the awardees per country, plus change percentages compared to July last year. Countries that show a 0 no longer have any published MVPs. This used to be a condensed table, but I have expanded the table and added fun facts such as MVPs per population and area as well, using apicountries.com as a reference.

CountryWasNowChangeMVPs per
1,000,000
MVPs per
1,000 km2
Albania110%             0,35         0,035
Angola110%             0,03         0,001
Argentina171912%             0,42         0,007
Australia1111132%             4,40         0,015
Austria323716%             4,15         0,441
Azerbaijan43-25%             0,30         0,035
Bahrain12100%             1,18         2,614
Bangladesh31-67%             0,01         0,007
Belgium59648%             5,54         2,096
Benin01100%             0,08         0,009
Bolivia54-20%             0,34         0,004
Bosnia and Herzegovina76-14%             1,83         0,117
Brazil1271367%             0,64         0,016
Bulgaria880%             1,15         0,072
Cambodia01100%             0,06         0,006
Cameroon13200%             0,11         0,006
Canada11513013%             3,42         0,013
Chile4525%             0,26         0,007
China137132-4%             0,09         0,014
Colombia1614-13%             0,28         0,012
Congo (DRC)41-75%             0,01         0,000
Costa Rica220%             0,39         0,039
Côte d’Ivoire110%             0,04         0,003
Croatia1311-15%             2,72         0,194
Czechia263119%             2,90         0,393
Denmark496022%           10,29         1,392
Dominican Republic36100%             0,55         0,123
Ecuador440%             0,23         0,014
Egypt81025%             0,10         0,010
El Salvador220%             0,31         0,095
Estonia440%             3,01         0,088
Finland333918%             7,05         0,115
France120113-6%             1,68         0,176
Gabon01100%             0,45         0,004
Georgia12100%             0,54         0,029
Germany14317724%             2,13         0,496
Ghana660%             0,19         0,025
Greece1110-9%             0,93         0,076
Guatemala13200%             0,18         0,028
Honduras110%             0,10         0,009
Hong Kong SAR6717%             0,94         6,341
Hungary86-25%             0,62         0,064
Iceland5620%           16,37         0,058
India11814725%             0,11         0,045
Indonesia7929%             0,03         0,005
Ireland3231-3%             6,21         0,441
Israel121742%             1,84         0,818
Italy69759%             1,26         0,249
Japan1511649%             1,30         0,434
Jordan110%             0,10         0,011
Kazakhstan01100%             0,05         0,000
Kenya7814%             0,15         0,014
Korea56584%             1,12         0,579
Latvia13200%             1,58         0,046
Lebanon110%             0,15         0,096
Lithuania65-17%             1,79         0,077
Luxembourg12100%             3,16         0,773
Malaysia75-29%             0,15         0,015
Malta13200%             5,71         9,494
Mauritius12100%             1,58         0,980
Mexico182117%             0,16         0,011
Morocco4775%             0,19         0,016
Myanmar110%             0,02         0,001
Nepal4525%             0,17         0,034
Netherlands17519511%           11,18         4,659
New Zealand32359%             6,88         0,129
Nicaragua32-33%             0,30         0,015
Nigeria2623-12%             0,11         0,025
North Macedonia5860%             3,84         0,311
Norway405025%             9,29         0,154
Oman01100%             0,20         0,003
Pakistan91567%             0,07         0,017
Panama31-67%             0,23         0,013
Paraguay110%             0,14         0,002
Peru131515%             0,45         0,012
Philippines660%             0,05         0,018
Poland667311%             1,92         0,233
Portugal23259%             2,43         0,271
Puerto Rico110%             0,31         0,113
Qatar01100%             0,35         0,086
Réunion10-100%                –   –
Romania121958%             0,99         0,080
Saudi Arabia440%             0,11         0,002
Senegal10-100%                –                 –  
Serbia71043%             1,45         0,113
Singapore202315%             4,05       32,394
Slovakia4525%             0,92         0,102
Slovenia770%             3,33         0,345
South Africa111427%             0,24         0,011
Spain10312218%             2,58         0,241
Sri Lanka10100%             0,46         0,152
Sweden809620%             9,27         0,213
Switzerland536319%             7,29         1,526
Taiwan45462%             1,96         1,271
Tanzania110%             0,02         0,001
Thailand16176%             0,24         0,033
Tunisia10-100%                –                 –  
Türkiye202420%             0,28         0,031
Ukraine141614%             0,36         0,027
United Arab Emirates3433%             0,40         0,048
United Kingdom27330411%             4,52         1,252
United States48955814%             1,69         0,058
Uruguay220%             0,58         0,011
Uzbekistan21-50%             0,03         0,002
Venezuela110%             0,04         0,001
Vietnam550%             0,05         0,015
Yemen110%             0,03         0,002

If you have questions or comments, please leave them in the comments below.

MVPs around the World (2024)

Update: Added Sankey diagram to display award relationships between 2023 to 2024.

Another year, another Microsoft MVP award cycle. Happy to report that yours truly received his 11th MVP Award

As every year, this is also a moment to have a quick peek at the MVP population. The numbers below are taken from the public MVP portal on July 11th. Comparing them to July of recent years should give an idea of trends and what award categories (and thus products) seem to have focus.

A few notes:

  • 3.187 public MVP profiles were processed.
  • The award categories Enterprise Mobility and M365 Development have ceased to exist and are now expertise areas. Most MVPs who used to be in these categories have moved to the Security and Developer Technologies categories.
  • More countries are now represented in the program compared to last year.

MVP Awardees per Category

The following chart and table display the awardees per award category from July 2019 to 2024, plus change percentages compared to previous years. Former Enterprise Mobility and M365 Developer awardees have mostly moved to Security and Developer Technologies.

Award Category Jul2020Jul2021%Jul2022%Jul2023%Jul2024%
AI Platform12213813%128-7%105-18%269156%
Business Applications24032335%3519%44226%4747%
Cloud and Datacenter Management2092195%164-25%136-17%111-18%
Data Platform3583929%364-7%335-8%307-8%
Developer Technologies69777010%715-7%7474%7612%
Enterprise Mobility11313318%14912%100-33%0-100%
Internet of Things000%00%430%430%
M3655125569%492-12%54110%64319%
M365 Development64698%59-14%7019%0-100%
Microsoft Azure46353415%5462%526-4%5270%
Mixed Reality000%00%450%35-22%
Security000%00%1710%30578%
Windows and Devices4342-2%457%6136%10267%
Windows Development1101209%92-23%37-60%30-19%
Total2931329612%3105-6%33598%36077%
Count2849322313%3023-6%31755%31870%

Note: The difference between total awards and total MVPs is caused by MVPs that are awarded in more than one category.

MVP Awardees per Country

The following chart and table display the awardees per country, plus change percentages compared to July last year.

CountryNo.(change)CountryNo.(change)CountryNo.(change)CountryNo.(change)
ALB1 (0%)SLV2 (0%)MKD5 (0%)SVK4 (100%)
AGO1 (100%)EST4 (300%)MYS7 (16%)SVN7 (16%)
ARG17 (30%)FIN33 (6%)MLT1 (100%)ZAF11 (0%)
AUS106 (-3%)FRA117 (-2%)MUS1 (100%)ESP100 (12%)
AUT31 (-7%)GEO1 (100%)MEX18 (5%)LKA10 (11%)
AZE4 (100%)DEU138 (6%)MAR4 (100%)SWE77 (1%)
BHR1 (0%)GHA6 (-15%)MMR1 (-50%)CHE52 (4%)
BGD3 (-25%)GRC11 (120%)NPL3 (-25%)TWN44 (-5%)
BEL58 (-2%)GTM1 (0%)NLD174 (4%)TZA1 (100%)
BOL5 (66%)HND1 (0%)NZL32 (-20%)THA16 (45%)
BIH6 (-15%)HKG6 (0%)NIC3 (200%)TUN1 (0%)
BRA124 (0%)HUN8 (-12%)NGA25 (38%)TUR20 (-5%)
BGR7 (-30%)ISL4 (0%)NOR39 (-12%)TGO0 (-100%)
CMR1 (0%)IND114 (40%)PAK9 (80%)UKR13 (44%)
CAN113 (-7%)IDN7 (-13%)PAN3 (200%)ARE3 (50%)
CHL4 (0%)IRL31 (-9%)PRY1 (0%)GBR272 (5%)
CHN132 (0%)ISR12 (-15%)PER13 (0%)USA481 (1%)
COL16 (14%)ITA68 (3%)PHL6 (-15%)URY2 (100%)
COD4 (100%)JPN146 (-12%)POL65 (8%)UZB2 (0%)
CRI2 (0%)JOR1 (100%)PRT22 (4%)VEN1 (0%)
CIV1 (0%)KAZ0 (-100%)PRI0 (-100%)VNM5 (0%)
HRV13 (-14%)KEN7 (133%)REU1 (100%)UZB2 (0%)
CZE24 (-20%)KOR54 (-17%)ROU11 (-43%)VEN1 (0%)
DNK47 (4%)LVA1 (-67%)SAU4 (-20%)VNM5 (0%)
DOM3 (-50%)LBN1 (100%)SEN0 (-100%)YEM1 (100%)
ECU4 (0%)LTU6 (200%)SRB7 (40%)
EGY8 (100%)LUX1 (0%)SGP19 (35%)

MVP Awards from 2023 to 2024

The Sankey diagram below displays the number of awarded categories moving from 2023 to 2024 (click to zoom). New awardees are categorized as “New,” and those who are no longer present on the MVP portal (e.g., no longer MVP) are categorized as “Out.” Note that new awardees getting awarded in multiple categories are counted as new for each category; in other words, there are not 632 new MVPs awarded this cycle.

If you have questions or comments, please leave them in the comments below.

Security Updates Exchange 2016-2019 (Aug2023)

Last update Oct10: Added note about TokenCacheModule.

The Exchange product group released August V2 updates for Exchange Server 2016 and 2019.

The vulnerabilities addressed in these Security Updates for Exchange Server are:

VulnerabilityCategorySeverityRating
CVE-2023-21709*Elevation of PrivilegeImportantCVSS:3.1 9.8 / 8.5
CVE-2023-38185Remote Code ExecutionImportantCVSS:3.1 8.8 / 7.7
CVE-2023-35368Remote Code ExecutionImportantCVSS:3.1 8.8 / 7.7
CVE-2023-38182Remote Code ExecutionImportantCVSS:3.1 8.0 / 7.0
CVE-2023-35388Remote Code ExecutionImportantCVSS:3.1 8.0 / 7.0
CVE-2023-38181SpoofingImportantCVSS:3.1 8.8 / 7.7

*) Requires additional steps; See below.

The Security Updates for each supported Exchange Server build are linked below:

ExchangeDownloadBuildKBSupersedes
Exchange 2019 CU13Download15.2.1258.25KB5030524KB5026261
Exchange 2019 CU12Download15.2.1118.37KB5030524KB5026261
Exchange 2016 CU23Download15.1.2507.32KB5030524KB5025903

CVE-2023-21709

CVE-2023-21709 requires additional steps, which need to be performed after installing the August updates. These steps will remove the TokenCacheModule from IIS, preventing IIS (thus implicitly Exchange) from caching security tokens for password-authenticated sessions (Anonymous, BasicAuth, and Client Certificates) at a performance penalty as every request needs to get re-authenticated. Documentation on these steps, as well as a script to implement or undo these changes, can be found here.

Update October 10: Removal of TokenCacheModule is no longer recommended, as the vulnerability has been addressed in a Windows patch, CVE-2023-36434.

AES256 in Cipher Block Chaining mode

After installing these August updates, AES256-CBC will be the default encryption mode. In order to allow decrypting of Microsoft Purview Information Protection or Active Directory Rights Management Services, additional configuration is required. If you utilize RMS with Exchange on-premises, consult the steps in this KB article.

Issue with Non-English Operating Systems

The issue with the initial release of the August 2023 SU’s has been fixed in the V2 versions. Take note of the What-if table in the August SU V2 publication on how to proceed if you already installed V1 using the workaround. TLDR;:

  • If you installed V1 successfully (English OS), no action is needed, and installing V2 is optional (will only increase Exchange build numbers).
  • If you installed V1 on a non-English OS with the workaround, uninstall August SU V1, restart, install August SU V2, and clean up the workaround (dummy ‘Network Service’ account)
  • If you did not install V1 on a non-English OS or tried installing without success and re-enabled services using ServiceControl.ps1 -AfterPatch, install the August SU V2 update.

Right after the release of the Security Update, reports came in from customers with failed deployments for non-English operating systems. Installing the SU failed, leaving their Exchange server in a non-functional state as Exchange-related services were disabled. After Microsoft investigated the issue, it was found the SU installer uses the textual “Network Service” security principal during configuration. This does not work in other languages, where it needs to be the localized name, e.g. Netzwerkdienst (German) or SERVICE LOCAL (French). Using the well-known SID for this service principal (S-1-5-20), or using this to look up the actual name, would be the way to address this. This is also what the workaround in the support article is basically doing:

  1. Restore the startup state of Echange services using $exscripts\ServiceControl.ps1 AfterPatch.
  2. Creating a dummy “Network Service” account.
  3. Manually add Full Control on the ACL of HKLM:\SOFTWARE\Microsoft\MSIPC\Server for the ‘real’ Network Service security principal, which is what the SU should be doing. Under this key is where licenses used for Azure Information Protection are stored.

While having a workaround helps, it is not very maintainable, which is why I expect Microsoft to publish an update for the Security Update. Also, the whole situation gives to think about the mindset of developers who apparently only test using English operating systems. With still significant on-premises Exchange presence in countries such as Germany and France, making code OS language-independent and having it tested could use improvement.

Fixed Issues

Apart from security fixes, these Security Updates also correct the following issues:

Issue FixedExchange 2016Exchange 2019
DST settings are inaccurate after an OS updateYesYes
Microsoft Exchange replication service repeatedly stops respondingYesYes
Chinese coded characters aren’t supported in Exchange Admin CenterYesYes
External email address field doesn’t display the correct usernameYesYes

Notes

  • Security updates are Cumulative Update level specific. You cannot apply the update for Exchange 2019 CU13 to Exchange 2019 CU12. When downloading, the security update will carry the same name for different Cumulative Updates, and I would suggest tagging the file name with the CU level when archiving it, e.g., Exchange2019-CU13-KBXXXXXX-x64-en.msp.
  • Similar to Cumulative Updates, Security Updates are cumulative, and you only need to install the latest SU for your CU.
  • If you have installed the Exchange Management Tools separately for managing your on-premises Exchange Servers or installed it after removal of the Last Exchange Server for recipient management, it is recommended to apply the Security Update.

On a final note, as with any patch or update, I’d recommend applying this in a test environment first prior to implementing it in production. However, it is not recommended to wait for regular maintenance cycles when it concerns security updates and follow a more agile approach; the ratings are an indication of the urgency.

MVP’s around the World (2023)

Another year, another Microsoft MVP award cycle. Happy and proud to report that yours truly received his 10th MVP Award. Thank you!

This is also a moment to have a quick peek at the MVP statistics. Below numbers are taken from the public MVP portal. Normally, notifications are sent out on July 1st, but this year we had a small delay. In anticipation of awardees also needing some time to accept their Non-Disclosure Agreement terms, these numbers are taken from July 18th. Comparing them to July of recent years should give an idea of the yearly trend, as people can get awarded every month. The yearly award cycle in July will logically see a drop.

Few points of attention:

  • Out of the 3.175 MVP’s published on the MVP portal, 142 do not disclose location, so those are not represented in below numbers.
  • New categories Security, Mixed Reality and Internet of Things were added.
  • New categories might result in MVP’s switching when those are a better indication of their community work.
  • Overall, more countries are now represented in the program compared to last year.
  • Numbers do not reflect changes throughout the year. The drop from just before the award cycle, which showed 3.440 MVP’s, is not visible.

MVP Awardees per Category

The following table contains the awardees per award category from July of 2019 up to 2023, plus change percentage.

ExpertiseJul2019Jul2020%Jul2021%Jul2022%Jul2023%
AI8412245%13813%128-7%105-18%
Business Applications16624045%32335%3519%44226%
Cloud and Datacenter Management232209-10%2195%164-25%136-17%
Data Platform3323588%3929%364-7%335-8%
Developer Technologies6446978%77010%715-7%7474%
Enterprise Mobility1061137%13318%14912%100-33%
Internet of Things000%00%00%430%
M365 Apps & Services4915124%5569%492-12%54110%
M365 Development476436%698%59-14%7019%
Microsoft Azure40946313%53415%5462%526-4%
Mixed Reality000%00%00%450%
Security000%00%00%1710%
Windows and Devices for IT5743-25%42-2%457%6136%
Windows Development119110-8%1209%92-23%37-60%
Award Count268729319%329612%3105-6%33598%
MVP Count263428498%322313%3023-6%31755%

Note: The difference between total number of awards and total number of MVP’s is because an MVP can be awarded in more than one category.

MVP Awardees per Country

The following table contains the awardees per country, plus change percentage compared to July last year.

CountryNo.(change)CountryNo.(change)CountryNo.(change)
Albania1 (0%)Honduras1 (100%)Paraguay1 (0%)
Argentina13 (-14%)Hong Kong6 (100%)Peru13 (0%)
Armenia0 (-100%)Hungary9 (0%)Philippines7 (-13%)
Australia109 (-2%)Iceland4 (-20%)Poland60 (13%)
Austria33 (13%)India81 (0%)Portugal21 (16%)
Azerbaijan2 (100%)Indonesia8 (0%)Puerto Rico1 (0%)
Bahrain1 (0%)Ireland34 (9%)Romania19 (11%)
Bangladesh4 (-34%)Israel14 (7%)Saudi Arabia5 (0%)
Belgium59 (7%)Italy66 (4%)Senegal1 (0%)
Bolivia3 (0%)Ivory Coast1 (0%)Serbia5 (66%)
Bosnia and Herzegovina7 (16%)Japan165 (0%)Singapore14 (0%)
Brazil123 (-9%)Kazakhstan1 (0%)Slovakia2 (0%)
Bulgaria10 (0%)Kenya3 (300%)Slovenia6 (-25%)
Cambodia1 (0%)Korea65 (10%)South Africa11 (-27%)
Canada121 (-5%)Latvia3 (-25%)Spain89 (14%)
Chile4 (-20%)Lithuania2 (0%)Sri Lanka9 (-31%)
China131 (24%)Luxembourg1 (0%)Sweden76 (0%)
Colombia14 (0%)Macedonia5 (0%)Switzerland50 (25%)
Costa Rica2 (-34%)Malaysia6 (-25%)Taiwan46 (12%)
Croatia15 (-7%)Malta0 (-100%)Thailand11 (10%)
Czech Republic30 (-4%)Mauritius0 (-100%)Netherlands167 (12%)
Denmark45 (18%)Mexico17 (-11%)Togo1 (100%)
Dom. Republic6 (-15%)Morocco2 (-50%)Tunisia1 (-50%)
Ecuador4 (100%)Myanmar2 (-34%)Turkey21 (10%)
Egypt4 (0%)Nepal4 (-20%)Ukraine9 (-25%)
El Salvador2 (0%)New Zealand40 (0%)UAE2 (-60%)
Estonia1 (-50%)Nicaragua1 (100%)UK258 (8%)
Finland31 (10%)Nigeria18 (50%)USA472 (1%)
France119 (8%)Norway44 (12%)Uruguay1 (0%)
Germany129 (4%)Pakistan5 (-17%)Uzbekistan2 (200%)
Ghana7 (0%)Palestine1 (0%)Venezuela1 (100%)
Greece5 (25%)Panama1 (0%)Vietnam5 (0%)
Guatemala1 (-50%)

If you have questions or comments, please leave them in the comments below.