The Exchange product group released the December 2025 Security Update for Exchange Server SE. Organizations that enrolled in the Extended Security Update program will also have access to December 2025 security updates for Exchange Server 2019 and Exchange Server 2016. These ESU updates will not be made available publicly.
The vulnerabilities addressed in these Security Updates for Exchange Server are:
Security updates are Cumulative Update level specific. You cannot apply the Exchange 2019 CU15 update to Exchange 2019 CU14. When downloading, the security update might carry the same name for different Cumulative Updates. Nowadays, Microsoft adds the KB article number as a reference, but I would still tag the file name with the CU level for archival purposes, e.g., Exchange2019-CU15-KBxxxxxxx-x64-en.exe.
Like Cumulative Updates, Security Updates are cumulative, and you only need to install the latest SU for your CU.
Suppose you have deployed Exchange Management Tools to manage your on-premises Exchange Servers or installed the tools after removing the Last Exchange Server for recipient management. In that case, it is recommended that you apply the Security Update.
On a final note, as with any patch or update, it is recommended that you apply it in a test environment before implementing it in production. However, it is not recommended to wait for regular maintenance cycles when it comes to security updates; a more agile approach is preferable, and the ratings indicate the level of urgency.
These Security Updates are the SUs for Exchange Server 2016 and 2019 that will be publicly available. Any Extended Security Updates (ESU) that might be released between now and April 2026 for these products need to be acquired by contacting your Microsoft Account Teams.
Auth Certificate Export
Be advised that after deploying the October SU, as a security measure, Export-ExchangeCertificate can no longer be used to export of the Auth Certificate. For more information, see KB5069337.
Notes
Security updates are Cumulative Update level specific. You cannot apply the update for Exchange 2019 CU15 to Exchange 2019 CU14. When downloading, the security update might carry the same name for different Cumulative Updates. Nowadays, Microsoft adds the KB article number as a reference, but I would still tag the file name with the CU level for archival purposes, e.g., Exchange2019-CU15-KB5063221-x64-en.exe.
Like Cumulative Updates, Security Updates are cumulative, and you only need to install the latest SU for your CU.
Suppose you have deployed Exchange Management Tools to manage your on-premises Exchange Servers or installed the tools after removing the Last Exchange Server for recipient management. In that case, it is recommended that you apply the Security Update.
On a final note, as with any patch or update, it is recommended that you apply it in a test environment before implementing it in production. However, it is not recommended to wait for regular maintenance cycles when it comes to security updates and follow a more agile approach; the ratings indicate the level of urgency.
The Exchange product group released the September 2025 Hotfix Updates for Exchange Server SE, Exchange Server 2019, and Exchange Server 2016.
Hotfix updates do not contain security fixes, but address issues. They also might introduce or add support for functionality changes, such as dedicated Exchange hybrid app support.
A gentle reminder that since the April 2025 security updates, Exchange hybrid supports the dedicated Exchange hybrid app. The dedicated Exchange hybrid app becomes mandatory in October 2025 for continued cross-premises functionality (free/busy, etc.). To make the required changes related to the Graph permissions model, you have some more time, as that will become required in October 2026. For more information, please visit this link.
Do note that Microsoft scheduled some planned disruptions.This is likely in an attempt to nudge those Exchange hybrid customers who have not yet implemented the new dedicated hybrid app. So, if you are running Exchange hybrid with mailboxes on-premises and in Exchange Online, have not deployed the April 2025 SU or later, or did not implement the dedicated Exchange hybrid app, here are some time windows to keep an eye on:
Symptoms: Users with mailboxes on-premises might not be able to see free/busy, MailTips or profile pictures from users with a mailbox in Exchange Online. Only EWS functionality is affected, thus things such as migration jobs and mail flow keep functioning.
For more information, keep an eye on the EHLO blog announcements.
The Exchange product group released the August 2025 Hotfix Updates for Exchange Server SE, Exchange Server 2019, and Exchange Server 2016. The SU for SE comes barely a month after the RTM release of Exchange SE RTM.
The vulnerabilities addressed in these Security Updates for Exchange Server are:
The November SUs for Exchange 2019 and Exchange 2016 introduced AMSI integration. AMSI was disabled by default after deploying this SU. Now, with the August 2025 SUs, AMSI body scanning will be enabled for all protocols. Consult the documentation on how to disable AMSI scanning should you encounter any issues.
Fixed Issues
Apart from security fixes and added features, these Security Updates also correct the following issues:
Security updates are Cumulative Update level specific. You cannot apply the update for Exchange 2019 CU15 to Exchange 2019 CU14. When downloading, the security update might carry the same name for different Cumulative Updates. Nowadays, Microsoft adds the KB article number as reference, but I would still tag the file name with the CU level for archival purposes, e.g., Exchange2019-CU15-KB5063221-x64-en.exe.
Like Cumulative Updates, Security Updates are cumulative, and you only need to install the latest SU for your CU.
Suppose you have deployed Exchange Management Tools to manage your on-premises Exchange Servers or installed the tools after removing the Last Exchange Server for recipient management. In that case, it is recommended that you apply the Security Update.
On a final note, as with any patch or update, it is recommended that you apply it in a test environment before implementing it in production. However, it is not recommended to wait for regular maintenance cycles when it comes to security updates and follow a more agile approach; the ratings indicate the level of urgency.
31Jul: Moved MVPs per country to bottom and expanded table.
Another year, another Microsoft MVP award cycle. Always a great moment to have a quick peek at the MVP population. Note that this year, this post took a while longer to get published. This is due to the date of awards being announced, as well as the vacation period, which caused delays in people confirming their renewal agreement.
The numbers below are taken from the public MVP portal on July 30th. Comparing them to July from recent years should give an idea of trends and what award categories (and thus products) have focus.
A few notes:
3.589 public MVP profiles were processed. The overall number went up compared to last year. However, compared to the MVPs of June, the overall number went down by 12%.
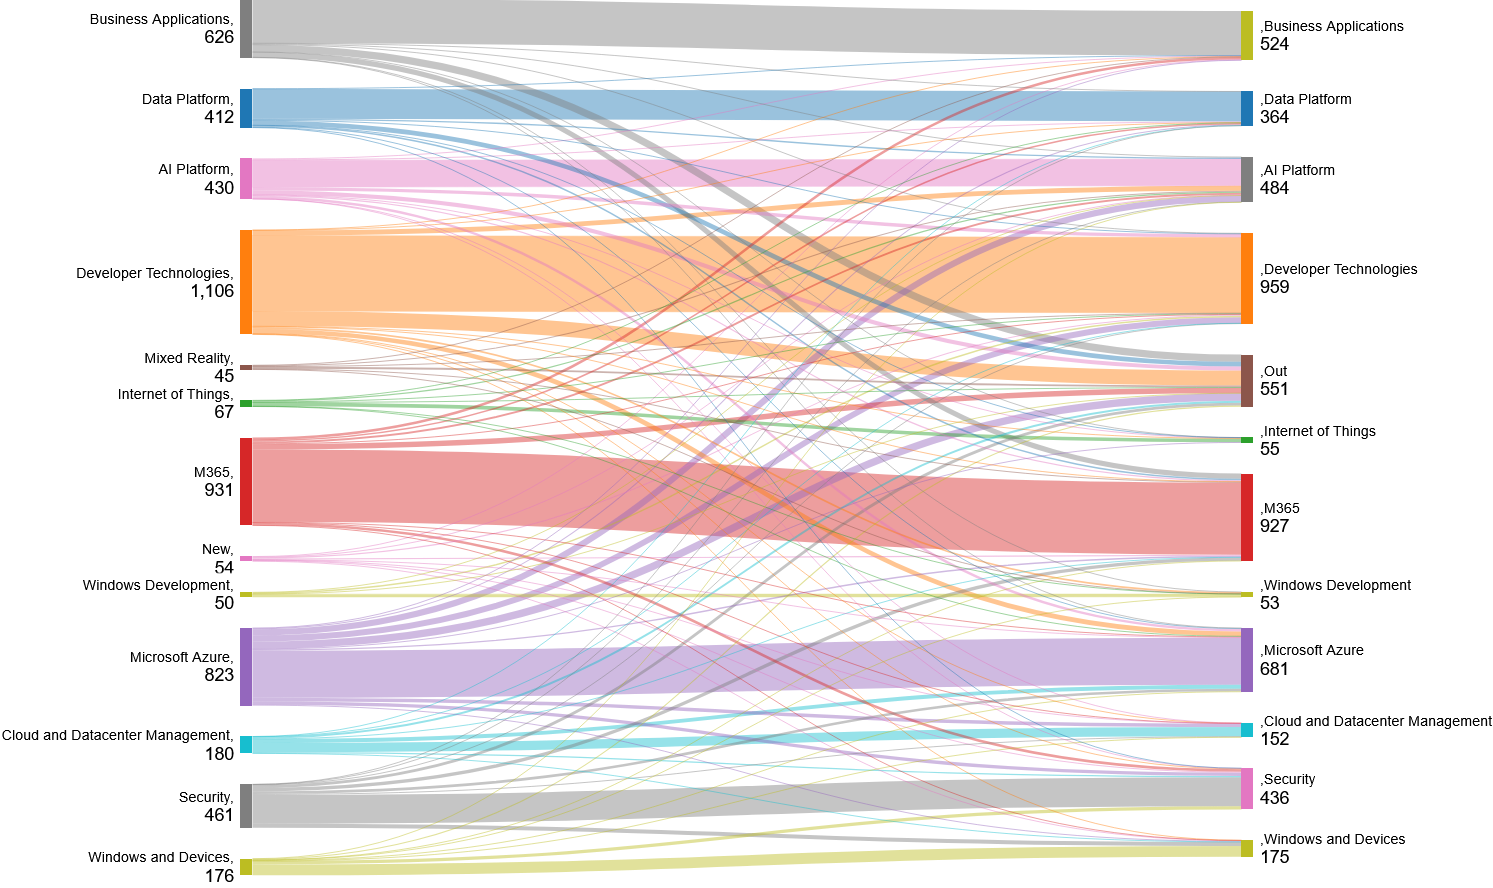
The award category Mixed Reality has been closed. Have a look at the Sankey diagram further down this article to see where these people went.
The number of countries represented went down when compared to last year.
The number of MVPs with more than one award category has increased by 13%.
The MVP award category with the most MVPs is still the Developer Technologies.
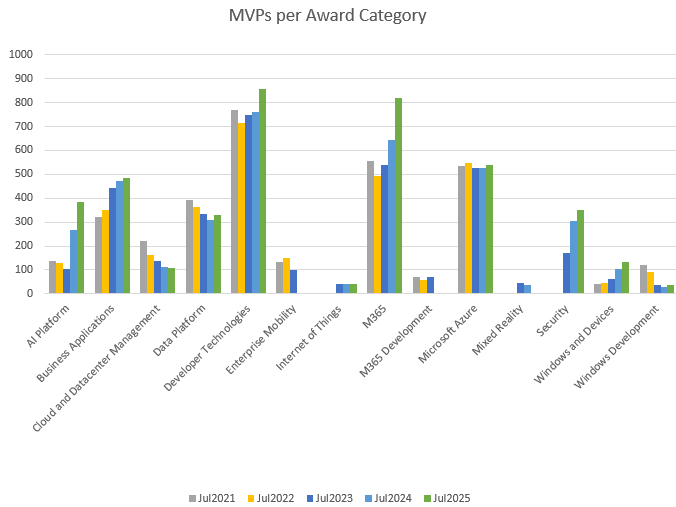
MVP Awardees per Category
The following chart and table display the awardees per award category from 2021 to 2025, plus change percentages compared to previous years.
Award Category
Jul2021
Jul2022
%
Jul2023
%
Jul2024
%
Jul2025
%
AI Platform
138
128
-7%
105
-18%
269
156%
386
43%
Business Applications
323
351
9%
442
26%
474
7%
483
2%
Cloud and Datacenter Management
219
164
-25%
136
-17%
111
-18%
106
-5%
Data Platform
392
364
-7%
335
-8%
307
-8%
329
7%
Developer Technologies
770
715
-7%
747
4%
761
2%
859
13%
Enterprise Mobility
133
149
12%
100
-33%
0
-100%
0
0%
Internet of Things
0
0
0%
43
0%
43
0%
39
-9%
M365
556
492
-12%
541
10%
643
19%
819
27%
M365 Development
69
59
-14%
70
19%
0
-100%
0
0%
Microsoft Azure
534
546
2%
526
-4%
527
0%
539
2%
Mixed Reality
0
0
0%
45
0%
35
-22%
0
-100%
Security
0
0
0%
171
0%
305
78%
349
14%
Windows and Devices
42
45
7%
61
36%
102
67%
133
30%
Windows Development
120
92
-23%
37
-60%
30
-19%
35
17%
Total Categories
3296
3105
-6%
3359
8%
3607
7%
4077
13%
Total MVPs
3223
3023
-6%
3175
5%
3187
0%
3589
13%
Note: The difference between total categories and total MVPs is caused by MVPs that are awarded in more than one category.
Where did they go?
The Sankey diagram below displays the number of awarded categories moving from last year to now. The move is based on the MVP, the categories they had, and the new categories they have currently been awarded in. New awardees are categorized as “New,” and those who are no longer present on the MVP portal (e.g., no longer MVP) are categorized as “Out.”
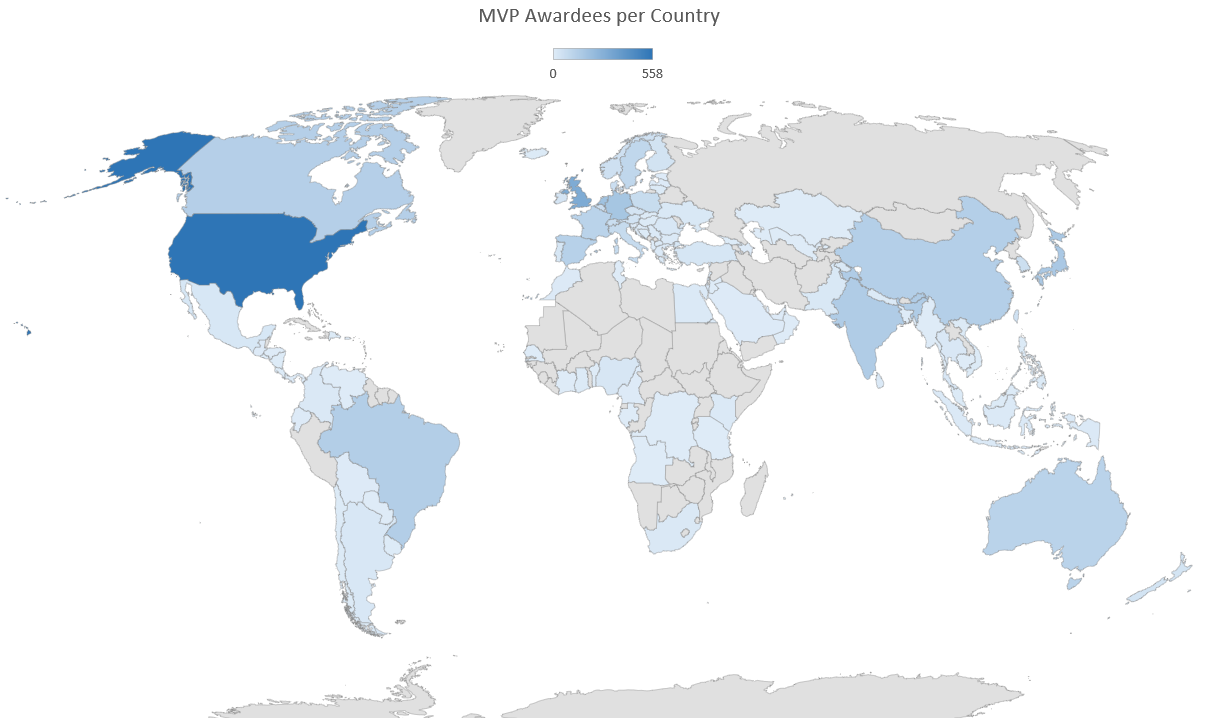
MVP Awardees per Country
The following chart and table display the awardees per country, plus change percentages compared to July last year. Countries that show a 0 no longer have any published MVPs. This used to be a condensed table, but I have expanded the table and added fun facts such as MVPs per population and area as well, using apicountries.com as a reference.
Country
Was
Now
Change
MVPs per 1,000,000
MVPs per 1,000 km2
Albania
1
1
0%
0,35
0,035
Angola
1
1
0%
0,03
0,001
Argentina
17
19
12%
0,42
0,007
Australia
111
113
2%
4,40
0,015
Austria
32
37
16%
4,15
0,441
Azerbaijan
4
3
-25%
0,30
0,035
Bahrain
1
2
100%
1,18
2,614
Bangladesh
3
1
-67%
0,01
0,007
Belgium
59
64
8%
5,54
2,096
Benin
0
1
100%
0,08
0,009
Bolivia
5
4
-20%
0,34
0,004
Bosnia and Herzegovina
7
6
-14%
1,83
0,117
Brazil
127
136
7%
0,64
0,016
Bulgaria
8
8
0%
1,15
0,072
Cambodia
0
1
100%
0,06
0,006
Cameroon
1
3
200%
0,11
0,006
Canada
115
130
13%
3,42
0,013
Chile
4
5
25%
0,26
0,007
China
137
132
-4%
0,09
0,014
Colombia
16
14
-13%
0,28
0,012
Congo (DRC)
4
1
-75%
0,01
0,000
Costa Rica
2
2
0%
0,39
0,039
Côte d’Ivoire
1
1
0%
0,04
0,003
Croatia
13
11
-15%
2,72
0,194
Czechia
26
31
19%
2,90
0,393
Denmark
49
60
22%
10,29
1,392
Dominican Republic
3
6
100%
0,55
0,123
Ecuador
4
4
0%
0,23
0,014
Egypt
8
10
25%
0,10
0,010
El Salvador
2
2
0%
0,31
0,095
Estonia
4
4
0%
3,01
0,088
Finland
33
39
18%
7,05
0,115
France
120
113
-6%
1,68
0,176
Gabon
0
1
100%
0,45
0,004
Georgia
1
2
100%
0,54
0,029
Germany
143
177
24%
2,13
0,496
Ghana
6
6
0%
0,19
0,025
Greece
11
10
-9%
0,93
0,076
Guatemala
1
3
200%
0,18
0,028
Honduras
1
1
0%
0,10
0,009
Hong Kong SAR
6
7
17%
0,94
6,341
Hungary
8
6
-25%
0,62
0,064
Iceland
5
6
20%
16,37
0,058
India
118
147
25%
0,11
0,045
Indonesia
7
9
29%
0,03
0,005
Ireland
32
31
-3%
6,21
0,441
Israel
12
17
42%
1,84
0,818
Italy
69
75
9%
1,26
0,249
Japan
151
164
9%
1,30
0,434
Jordan
1
1
0%
0,10
0,011
Kazakhstan
0
1
100%
0,05
0,000
Kenya
7
8
14%
0,15
0,014
Korea
56
58
4%
1,12
0,579
Latvia
1
3
200%
1,58
0,046
Lebanon
1
1
0%
0,15
0,096
Lithuania
6
5
-17%
1,79
0,077
Luxembourg
1
2
100%
3,16
0,773
Malaysia
7
5
-29%
0,15
0,015
Malta
1
3
200%
5,71
9,494
Mauritius
1
2
100%
1,58
0,980
Mexico
18
21
17%
0,16
0,011
Morocco
4
7
75%
0,19
0,016
Myanmar
1
1
0%
0,02
0,001
Nepal
4
5
25%
0,17
0,034
Netherlands
175
195
11%
11,18
4,659
New Zealand
32
35
9%
6,88
0,129
Nicaragua
3
2
-33%
0,30
0,015
Nigeria
26
23
-12%
0,11
0,025
North Macedonia
5
8
60%
3,84
0,311
Norway
40
50
25%
9,29
0,154
Oman
0
1
100%
0,20
0,003
Pakistan
9
15
67%
0,07
0,017
Panama
3
1
-67%
0,23
0,013
Paraguay
1
1
0%
0,14
0,002
Peru
13
15
15%
0,45
0,012
Philippines
6
6
0%
0,05
0,018
Poland
66
73
11%
1,92
0,233
Portugal
23
25
9%
2,43
0,271
Puerto Rico
1
1
0%
0,31
0,113
Qatar
0
1
100%
0,35
0,086
Réunion
1
0
-100%
–
–
Romania
12
19
58%
0,99
0,080
Saudi Arabia
4
4
0%
0,11
0,002
Senegal
1
0
-100%
–
–
Serbia
7
10
43%
1,45
0,113
Singapore
20
23
15%
4,05
32,394
Slovakia
4
5
25%
0,92
0,102
Slovenia
7
7
0%
3,33
0,345
South Africa
11
14
27%
0,24
0,011
Spain
103
122
18%
2,58
0,241
Sri Lanka
10
10
0%
0,46
0,152
Sweden
80
96
20%
9,27
0,213
Switzerland
53
63
19%
7,29
1,526
Taiwan
45
46
2%
1,96
1,271
Tanzania
1
1
0%
0,02
0,001
Thailand
16
17
6%
0,24
0,033
Tunisia
1
0
-100%
–
–
Türkiye
20
24
20%
0,28
0,031
Ukraine
14
16
14%
0,36
0,027
United Arab Emirates
3
4
33%
0,40
0,048
United Kingdom
273
304
11%
4,52
1,252
United States
489
558
14%
1,69
0,058
Uruguay
2
2
0%
0,58
0,011
Uzbekistan
2
1
-50%
0,03
0,002
Venezuela
1
1
0%
0,04
0,001
Vietnam
5
5
0%
0,05
0,015
Yemen
1
1
0%
0,03
0,002
If you have questions or comments, please leave them in the comments below.