When performance troubleshooting Exchange 2003 or Exchange 2007 you may, without System Center, end up using performance monitor, generating performance log files, checking what to look for and analyse logs accordingly correlating events in the process and know what to look for when trying to zoom in on the potential performance issues. Performing this analysis might be a lengthy process as you need to go through several counters looking for specific values, trends or tresholds within a certain period.
Performance Analysis of Logs (PAL) tool to the rescue. This tool, from Microsoft Services, tries to speed up the process for administrators. It can analyse performance log files and use certain sets of preconfigured XML treshold files for certain applications files to report on potential issues. All you need to do is configure logging, feed the performance log file to PAL, configure the application the system is running and generate the report. There are also files for Exchange 2003 and 2007 (not yet for 2010).
PAL installs on Windows XP, Windows Vista, Windows Server 2003 or Windows Server 2008 and Windows 7. In addition it requires LogParser 2.2 as well as Office Web Components 11 and .NET Framework 2.0 (for the UI). The setup of PAL checks the prerequisites and directs you to the proper location to download these if required.
To start using the PAL tool proceed as follows:
- Start PAL;
- Select tab Counter Log. Here you specify which performance counter log file (blg or csv) to analyze. If required select a timeframe;
- Select tab Treshold File and select the .XML file to use for analysis. For Exchange, select the Exchange version as well as the role(s) of the server you are troubleshooting, e.g. Microsoft Exchange 2007 – HUB:

Note that the XML file also can contain interactive elements in the form of questions, e.g. was the system 64-bit, how many CPUs are present etc. You need to configure these by setting the proper values in the Question Variable Names section;
- Select Analysis Interval tab. This is the interval to determine the min, average, maximum and trends when analysing. By default the whole time window is divided in 30 slices when you leave this setting to AUTO;
- Select Output Options tab to configure where and how you want the report to be saved;
- If you select Queue you can see the constructed commandline with all the options you configured. Yes, you can run PAL from the commandline, which might be convenient when you need to repeat the same job, run it for a different server or different time window;
- When you’re all set, select tab Execute and click Finish. A window will open where the output of the commandline and progress of the job will be shown. After the job is finished you will be presented an HTML report with information on relevant events and charts.

If you want to configure or inspect the tresholds, select Edit in the Treshold File tab or have a peek directly in the XML files; they are located in the PAL installation folder. When you select edit you might see something like the screen below. Its an overview of counters, instances, descriptions and tresholds.

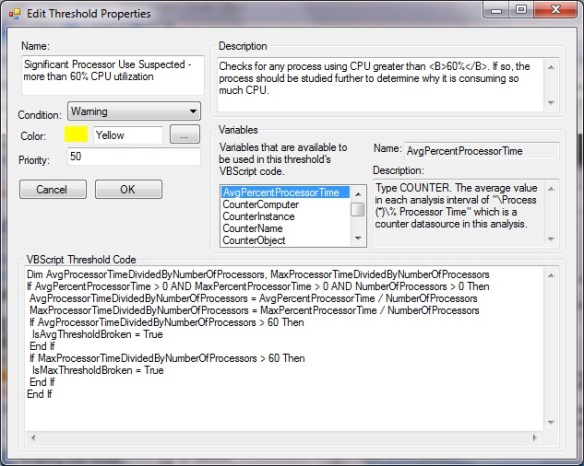
The tresholds really are snippets of VB code which can process the available numbers and information taken from the questions to determine if a warning or alert should be generated. These snippets of VB code can be accessed by selecting a treshold and clicking Edit.
In the example above we see that a warning condition is to be generated for a certain number of CPU utilization. We also see that information from questions is taken into account, e.g. NumberOfProcessors. For each treshold we can specify the condition to raise, e.g. if the minimum (IsMinTresholdBroken), average (IsAvgTresholdBroken), maximum (IsMaxTresholdBroken) or trend (IsTrendTresholdBroken) has been reached.
I think PAL isn’t a “Poor Man’s SCOM” tool and believe PAL can be a real valuable time saver for administrators. At the moment PAL comes with files for Active Directory, Biztalk 2004+2006, Exchange 2003+2007, Hyper-V, IIS 5+6, MOSS 2007, Project Server, SQL 2000+2005 and (generic) Windows Server OS. You can download the tool from codeplex here. The Exchange 2003 and 2007 treshold files are maintained by Mike Lagase; you can download the latest PAL Exchange XML files here. To update these files, extract them in the location where you installed PAL, e.g. “C:\Program Files\PAL\PAL v1.3.5”. Note that the PAL team is working on a 2.0 PowerShell version of PAL.


Pingback: Performance Analysis of Logs 2.0 « EighTwOne (821)