MVPs around the World (2021)

A new Microsoft MVP award cycle, a new moment to have a look at the MVP statistics. Below numbers are taken from the public MVP site. While July 1st is the first day of the new award cycle, it usually is recommended to wait few days for the site and data behind it to get updated. and new and renewed awardees turning in their Non-Disclosure Agreement before showing up on the site. Because people get awarded every month, the comparison to July of every year should give an idea of the yearly trend.

Disclaimer: A percentage of MVP awardees are anonymous, and do not disclose information regarding expertise or location. There are currently 133 anonymous MVPs, and they are not taken into account in below statistics.

The following table contains the awardees per award category from July of 2019, 2020 and 2021, and change percentage compared to the year before. I will leave the interpretation up to you.

ExpertiseJul2019Jul2020%Jul2021%
Cloud and Datacenter Management232209-10%2195%
Microsoft Azure40946313%53415%
Office Apps & Services4915124%5569%
Business Applications16624045%32335%
Data Platform3323588%3929%
Developer Technologies6446978%77010%
Enterprise Mobility1061137%13318%
AI8412245%13813%
Office Development476436%698%
Windows Development119110-8%1209%
Windows and Devices for IT5743-25%42-2%
Total268729319%329612%
Count263428498%322313%

Note: The total number of MVPs doesn’t equal the total number of awardees, as MVPs can be awarded in more than one category. A total of 77 MVPs are awarded in two or more categories.

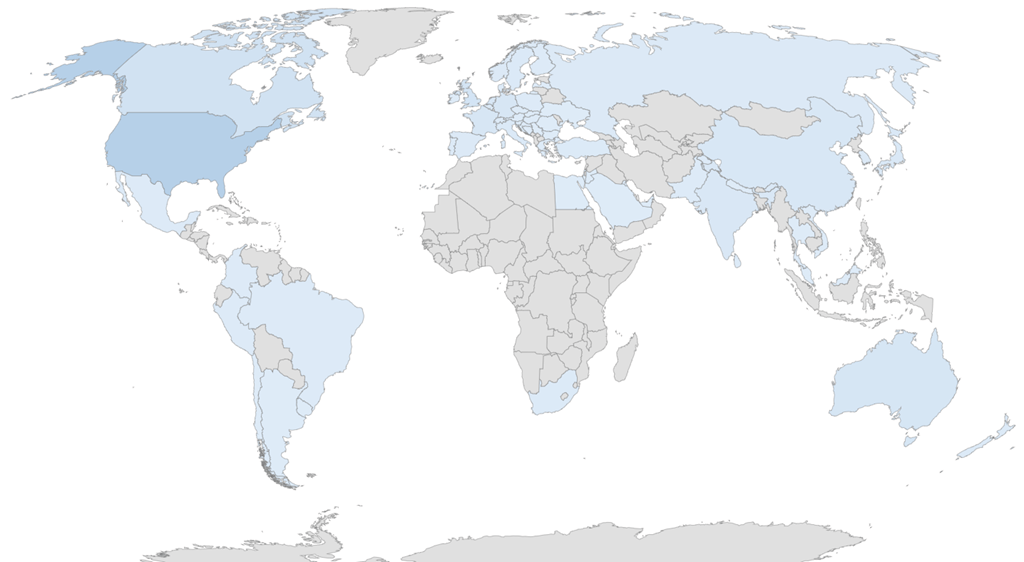
When zooming in on the Office Apps & Services category, the awards per country are shown below, including the % change compared to last year. As you might notice, there are quiet a number of new countries being represented: Ghana, Greece, Peru, Senegal and Vietnam. This supports the current Diversity & Inclusion mindset, and in my opinion is a good thing.

CountryNumberCountryNumberCountryNumberCountryNumber
AUS26 (8%)FRA22 (22%)NZL6 (0%)LKA1 (0%)
AUT3 (0%)DEU30 (25%)NGA3 (50%)SWE10 (11%)
BEL5 (0%)GHA1 (100%)NOR6 (0%)CHE3 (0%)
BIH1 (0%)GRC1 (100%)PAK1 (0%)TWN4 (0%)
BRA10 (25%)HUN2 (0%)PER1 (100%)THA2 (0%)
BGR3 (50%)IND12 (-8%)POL6 (0%)NLD22 (0%)
KHM1 (0%)IRL2 (100%)PRT3 (0%)TUR2 (0%)
CAN34 (3%)ISR3 (200%)RUS9 (0%)UKR2 (0%)
CHN17 (0%)ITA5 (0%)SAU1 (0%)ARE2 (100%)
COL6 (20%)JPN20 (0%)SEN1 (100%)GBR38 (15%)
HRV5 (0%)KOR14 (16%)SRB1 (0%)USA131 (6%)
CZE2 (0%)MKD2 (0%)SGP4 (33%)URY1 (0%)
DNK6 (0%)MYS1 (0%)SVK1 (0%)VNM1 (100%)
EGY1 (0%)MEX7 (40%)SVN2 (0%)
SLV1 (0%)MMR1 (0%)ZAF4 (0%)
FIN6 (50%)NPL1 (0%)ESP14 (16%)

And finally, the number of Office Apps & Services and total number of MVP’s over the last years.

OAS & Total PER CYCLEJul2017Jul2018Jul2019Jul2020Jul2021
Office Apps & Services MVPs449383491512535
% Change-15%28%4%4%
Total MVPs34903030263428493223
% Change-13%-13%8%13%

If you have questions or comments, please leave them in the comments below.

MVPs around the World (2020)

With great honor and joy I can announce that I have been awarded the Microsoft Most Valuable Professional award for the seventh consecutive year, again in the category Office Apps & Services. Congratulations to other new and re-awarded MVPs as well, and kudos to the MVP program in undertaking the monstrous task of reviewing and evaluating thousands of contributions every award cycle.

With another award cycle also comes the time to have a look at the MVP statistics. Below numbers are taken from the public MVP site. July 3rd is chosen as the first days the site gets updated and new awardees need to turn in their NDA before they show up on the site.

Because people can get awarded each month, the comparison to July 3rd of every year indicates only yearly trend. Therefor we’ll also compare the numbers to those of June to see the impact on long-term MVP population, as awardees from January are only up for consideration in July 2021 for example.

From the numbers, it is clear that this cycle the number of MVPs went a bit down from 2.998 in June 2020 to 2.850 now (-5%), but it is higher than the 2.634 (+8%) of July 2019.

The following table contains the changes per award category from July 2019 and June 2020 to July 2020. I will leave the interpretation up to you.

ExpertiseJuly 2019June 2020ChangeJuly 2020Change
Cloud and Datacenter Management2322424%209-10%
Microsoft Azure40945511%46313%
Office Apps & Services4915308%5124%
Business Applications16623441%24045%
Data Platform33237513%3588%
Developer Technologies64474215%6978%
Enterprise Mobility10611912%1137%
AI8410930%12245%
Office Development476028%6436%
Windows Development1191233%110-8%
Windows and Devices for IT5755-4%43-25%
Total Awards2687304413%29319%
Total MVPs2634299814%28498%

Note: The total number of MVPs doesn’t equal the total number of awardees, as MVPs can be awarded in more than one category; there are now 82 people awarded in multiple categories’; an increase of 57% compared to June 2019.

When zooming in on the Office Apps & Services category, the awards per country are shown below, including change compared to last year. Be advised that 26 OAS MVPs are anonymous or have profiles without information on residency.

image
CountryNumberCountryNumberCountryNumber
Australia24 (20%)India13 (0%)Saudi Arabia1 (0%)
Austria3 (0%)Ireland1 (0%)Serbia1 (0%)
Belgium5 (-38%)Israel1 (0%)Singapore3 (0%)
Bosnia and Herzegovina1 (0%)Italy5 (-17%)Slovakia1 (0%)
Brazil8 (-20%)Japan20 (-10%)Slovenia2 (0%)
Bulgaria2 (0%)Korea12 (0%)South Africa4 (-20%)
Cambodia1 (100%)Luxembourg1 (100%)Spain12 (50%)
Canada33 (6%)Macedonia, FYRO2 (0%)Sri Lanka1 (0%)
China17 (6%)Malaysia1 (0%)Sweden9 (80%)
Colombia5 (25%)Mexico5 (0%)Switzerland3 (50%)
Croatia5 (25%)Myanmar1 (100%)Taiwan4 (0%)
Czech Republic2 (0%)Nepal1 (0%)Thailand2 (-34%)
Denmark6 (0%)New Zealand6 (0%)The Netherlands22 (4%)
Egypt1 (0%)Nigeria2 (100%)Turkey2 (0%)
El Salvador1 (0%)Norway6 (0%)Ukraine2 (0%)
Finland4 (33%)Pakistan1 (-50%)United Arab Emirates1 (-50%)
France18 (-10%)Poland6 (50%)United Kingdom33 (17%)
Germany24 (-4%)Portugal3 (50%)United States123 (2%)
Hungary2 (0%)Russia9 (12%)Uruguay1 (0%)

And last, the number of Office Apps & Services and total number of MVP’s over the last years, before and after the award cycle.

June
2017
July
2017
June
2018
July
2018
March
2019
July
2019
June
2020
July
2020
OSS532449490383622491530512
-16%9%-22%62%-21%8%-3%
Total41343490381530303205263429982849
-16%9%-21%6%-18%14%-5%

On a final note, the above data is static; some MVPs have build great dashboards which allow you to work with the data more interactively (if they have updated their data set, that is). Some noteworthy mentions:

If you have questions or comments, please leave them in the comments below.

MVP’s around the World (2019)

mvp

Update: Updated statistics based on award categories (not people) due to the number of multi-category awardees.

In previous years, I performed some comparisons on the MVP population after every award cycle. So, time to get some fresh statistics after July 2019 award cycle.

For comparison, I had a look at the public MVP statistics of July 3rd, 2018 against those of July 3rd, 2019, as the public MVP site was closed the first two days. From the numbers, it is clear that this cycle the number of MVPs went down again, from 3.030 last year, to 2.634 now (-13%).

The following table contains the changes per award category from July 2018 to
July 2019:

CompetenceJul-18Jul-19Change
AI588445%
Business Applications1641660%
Cloud and Datacenter Management303232-23%
Data Platform369332-10%
Enterprise Mobility122106-13%
Microsoft Azure444409-8%
Office Development334742%
Office Apps & Services606491-19%
Developer Technologies781644-17%
Windows and Devices for IT8757-34%
Windows Development186119-37%
Total MVPs30662634-14%

Few notes:

  • The total number of MVP’s doesn’t equal the total number of awards, as people can be awarded in more than one category; there are 52 MVP’s with multiple award categories (one even in 3 categories).
  • Former single product categories, such as Access or OneNote, were moved under the Office Apps & Services category (which was rebranded from Office Servers & Services). Those numbers are merged for the 2018 column.
  • When comparing to earlier years, the award categories were restructured in 2017, e.g. Visual Studio and Development Technologies became Developer Technologies.

When zooming in on the Office Apps & Services category, the awards per country are shown below. Be advised that 26 are anonymous MVP’s or have profiles without location.

CountryJul’18Jul’19CountryJul’18Jul’19CountryJul’18 Jul’19
ARE12GBR2328POL24
AUS1720HRV54PRK612
AUT23HUN22PRT32
BEL88IND1213RUS58
BGR12IRL11SAU11
BIH11ISR1SGP33
BRA210ITA86SLV1
CAN2831JOR11SRB11
CHE42JPN1122SVK11
CHN1416LKA41SVN12
COL24MEX25SWE65
CRI1MKD22THA13
CZE32MYS11TUR42
DEU1725NGA11TWN3
DNK26NLD1321UKR12
EGY11NOR56URY11
ESP58NPL11USA89120
FIN23NZL46ZAF45
FRA1620PAK22

The countries Argentina, Chile, Latvia, Peru, Romania and Greece are no longer represented in the Office Apps & Services category, while Costa Rica, Israel, Taiwan and El Salvador are new to the table.

MonthOct
2016
Jan
2017
Jun
2017
Jul
2017
Jun
2018
Jul
2018
Mar
2019
Jul
2019
OSS538505
(-7%)
532
(+5%)
449
(-16%)
490
(+2%)
383
(-21%)
622
(+62%)
491
(-22%)
TotalN/AN/A41343490
(-16%)
3815
(+2%)
3030
(-21%)
3205
(+6%)
2635
(-18%)

Above are the number of Office Apps & Services and total number of MVP’s over the last years. Do note that for March and July 2019 the former product categories are included in the Office Apps & Services category, hence why I included March to have a sense of the changes in the July cycle.

If you have questions or comments, please send them in the comments below.

MVP’s around the World

mvpUpdated July 3rd:  Includes newly registered awardees and awardees who changed category. Added overview of Office Servers and Services numbers over last couple of years.

With the latest annual award cycle, one might be curious which impact it had on the MVP population. I performed a similar exercise last year to compare the impact of the start of the new award cycle. This year, all the MVP’s previously on the January and October cycles were also included in the reviews, making this year the first one where MVP leads and others had to perform the dauntless task of reviewing community contributions of over 3,500 people.

For comparison, I had a look at the public MVP statistics of July 1st against those of June 26th, to exclude significant noise from the monthly awardees. To start, let us first have a look at the total population of MVP’s. From the numbers, it is clear some type of correction took place, as the total number of MVP’s went down from 3,815 last month to 3,025 now (-21%).

As big changes might be a result of change of focus, the following table contains the changes per award category from June 2018 to July 2018. Note that the total number of MVP’s doesn’t equal the total number of awardees, as people can be awarded in more than one category; there are 50 MVP’s with multiple award categories.

Competence Jun2018 July2018 Change
Access 39 29 -26%
AI 28 58 107%
Business Solutions 221 184 -17%
Cloud and Datacenter Management 410 302 -26%
Data Platform 442 366 -17%
Enterprise Mobility 159 122 -23%
Excel 103 84 -18%
Microsoft Azure 370 368 -1%
Office Development 44 33 -25%
Office Servers and Services 490 383 -22%
OneNote 15 12 -20%
Outlook 14 11 -21%
PowerPoint 40 34 -15%
Visio 15 10 -33%
Visual Studio and Development
Technologies
1043 780 -25%
Windows and Devices for IT 136 87 -36%
Windows Development 273 186 -32%
Word 23 19 -17%
Total 3865 3066 -21%

Except for the AI MVP’s, all the numbers are down. Way down. Word is quite a number of long-standing MVP’s have not been re-awarded this cycle. One could only guess for the motivation (only Microsoft knows), but it could be due to the ongoing shift from on-premises technology to cloud-based technology.

When zooming in on the Office Servers and Services MVP’s category, the awards per country is shown in the following heath map and table. Be advised that MVP’s that are anonymous or have profiles without location (~23 for Office Servers and Services), are not taken into account since their location is unknown.

image

Country Number Country Number Country Number
Argentina 0 (-100%) Ireland 1 (0%) Saudi Arabia 1 (0%)
Australia 17 (-40%) Israel 0 (-100%) Serbia 1 (0%)
Austria 2 (0%) Italy 8 (-20%) Singapore 3 (-25%)
Belgium 8 (0%) Japan 11 (-45%) Slovakia 1 (0%)
Bosnia-Herzegovina 2 (0%) Jordan 1 (0%) Slovenia 1 (-50%)
Brazil 2 (-34%) Korea 6 (-15%) South Africa 4 (-20%)
Bulgaria 1 (0%) Latvia 1 (0%) Spain 5 (-17%)
Canada 29 (-24%) Macedonia F.Y.R.O 2 (0%) Sri Lanka 4 (-43%)
Chile 1 (0%) Malaysia 1 (-50%) Sweden 6 (-25%)
China 14 (-13%) Mexico 2 (-50%) Switzerland 5 (0%)
Colombia 2 (0%) Nepal 1 (0%) Thailand 1 (0%)
Croatia 5 (-17%) New Zealand 4 (-20%) The Netherlands 13 (-8%)
Czech Republic 3 (-25%) Norway 5 (-17%) Turkey 4 (-20%)
Denmark 2 (-50%) Pakistan 2 (0%) Ukraine 1 (-50%)
Egypt 1 (-50%) Peru 1 (-50%) United Arab Emirates 1 (-50%)
Finland 2 (0%) Poland 2 (0%) United Kingdom 23 (-15%)
France 15 (-12%) Portugal 3 (-25%) United States 90 (-19%)
Germany 16 (-20%) Romania 1 (-50%) Uruguay 1 (0%)
Greece 1 (0%) Russia 5 (-50%) Vietnam 0 (-100%)
Hungary 2 (-50%) TOTAL 383 (-22%)
India 12 (-8%)

As shown, some countries have lost their Office Servers and Service MVP’s completely. Looking at the total number of Office Servers and Services MVP’s over the year, the number went a little up again due to monthly awardees, but with the July cycle, the number of Office Servers and Services MVP’s went from 490 to 383 (-22%).

The number of Office Servers and Services and total number of MVP’s over the last years (since award restructuring).

Month oct2016 jan2017 jun2017 jul2017 jan2018 jun2018 jul2018
OSS 538 505 (-7%) 532 (+5%) 449 (-16%) 480 (+6%) 490 (+2%) 383 (-21%)
Total N/A N/A 4134 3490 (-16%) 3747 (+7%) 3815 (+2%) 3030  (-21%)

Unfortunately, I have no data on the other categories from before june 2017.

If you have questions or comments, please discuss in the comments.

2018-2019 Microsoft MVP Award

With great joy and honor I can announce that I have been awarded the Microsoft Most Valuable Professional Award in the category Office Servers and Services (localized e-mail):

image

MVP awards are given to individuals by Microsoft in recognition of their contributions to the community, such as:

  • Writing blogs, articles, books.
  • Speaking engagements or podcasts.
  • Supporting others, e.g. forum or TechCommunity contributions.
  • Code contributions.
  • Product feedback.

This is my 5th consecutive year as an MVP. I used to be an “October MVP”, which meant my award was up in October every year. After the award cycle changed to a yearly one for everyone, this year was the first time all MVP’s who fell under the old quarterly cycles, were being up for renewal. It also meant, contributions of a longer period of time were being evaluated. So lots of kudos to the MVP leads and other folks that had to go through the monstrous task of reviewing thousands of contributions for this cycle.

Many thanks to the community, readers, followers, fellow MVP’s and friends, peers, product groups and other Microsoft employees for their encouragement, inspiration and support over all those years.

My MVP profile can be found here.