MVP’s around the World (2022)


A new Microsoft MVP award cycle, a new moment to have a look at the MVP statistics. Below numbers are taken from the public MVP site. July 1st is normally the day of the award cycle, but this year got delayed for a few days due to unknown circumstances. Because people get awarded every month, the comparison to July of every year should give an idea of the yearly trend.

Few points of attention:

  • Apparently, during the award cycle MVP’s located in Russia or Belarus were removed, including MVP’s that were awarded in the first half of 2022 and thus not up for renewal.
  • 19 anonymous MVP awardees do not disclose location. Those are not represented in below numbers.
  • The Office Development category was rebranded M365 Development.
  • The Office Apps & Services category was rebranded M365 Apps & Services.

Awardees per Category

The following table contains the awardees per award category from July of 2019 up to 2022, plus change percentage. It therefor does not reflect on changes during the year (people newly awarded or moving to Microsoft). I will leave the interpretation up to you.

ExpertiseJul’19Jul’20%Jul’21%Jul’22%
Cloud and Datacenter Management232209-10%2195%164-25%
Microsoft Azure40946313%53415%5462%
M365 Apps & Services4915124%5569%492-12%
Business Applications16624045%32335%3519%
Data Platform3323588%3929%364-7%
Developer Technologies6446978%77010%715-7%
Enterprise Mobility1061037%13318%14912%
AI8412245%13813%128-7%
M365 Development476436%698%59-14%
Windows Development119110-8%1209%92-23%
Windows and Devices for IT5743-25%42-2%457%
Total no. of Awards268729319%329612%3105-6%
Total no. of MVP’s263428508%322413%3024-6%

Note: The difference between total number of awards and total number of MVP’s is caused by MVP’s awarded in multiple categories. A total of 124 MVP’s were awarded in two or more categories.

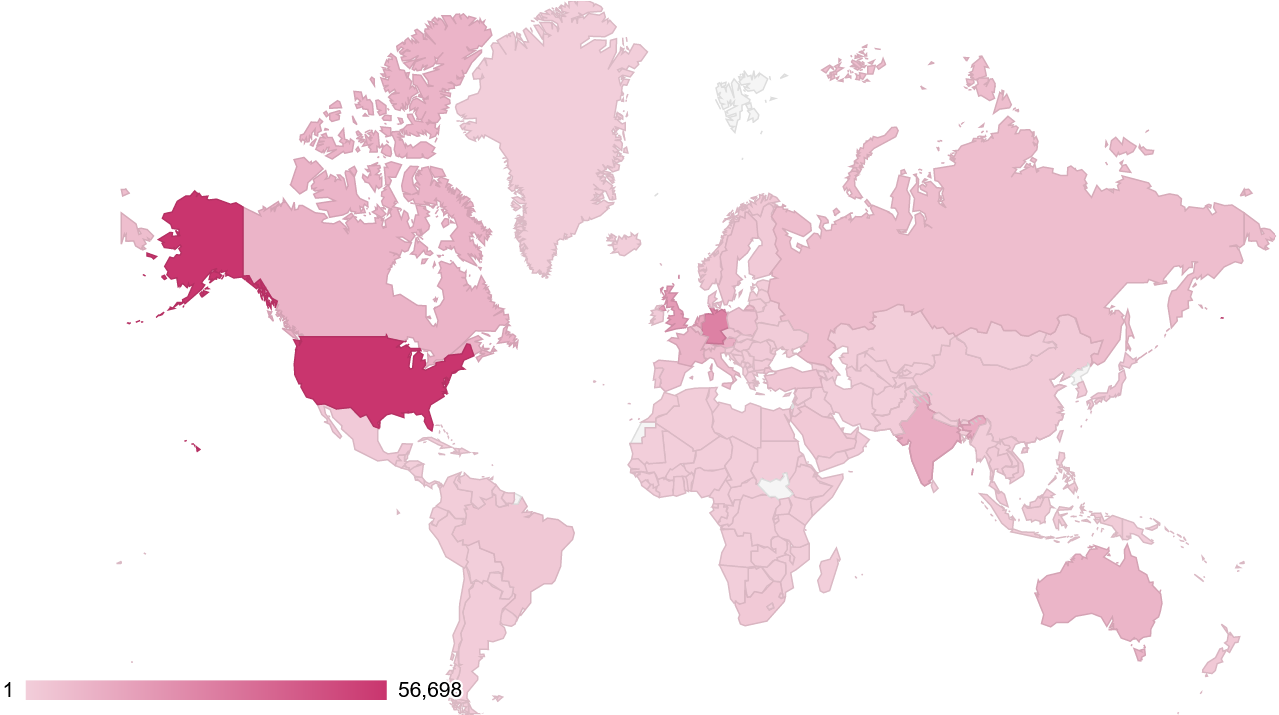
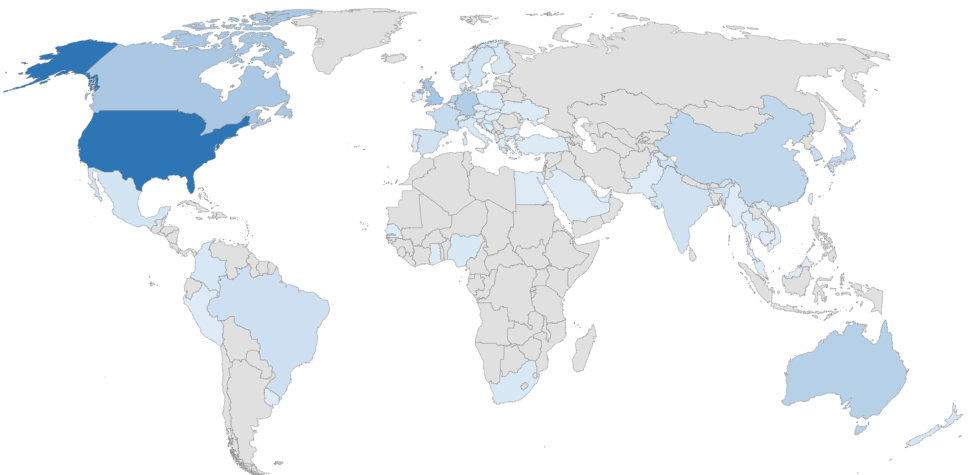
M365 Apps & Services per Country

When zooming in on the M365 Apps & Services category, the awards per country are shown below, including the % change compared to last year. As you might notice, there are quiet a number of countries without MVP’s compared to last year.

CountryNumberCountryNumberCountryNumberCountryNumber
AUS26 (-4%)FRA16 (-34%)NZL6 (0%)ESP10 (-34%)
AUT3 (-25%)DEU30 (-4%)NGA4 (0%)LKA0 (-100%)
BEL5 (0%)GHA1 (0%)NOR5 (-29%)SWE8 (-20%)
BIH1 (0%)GRC1 (0%)PAK1 (0%)CHE2 (-50%)
BRA12 (-15%)HUN1 (-50%)PER1 (0%)TWN4 (0%)
BGR3 (0%)IND10 (-29%)POL5 (-38%)THA2 (0%)
KHM1 (0%)IRL1 (-75%)PRT3 (0%)NLD22 (4%)
CAN34 (-15%)ISR3 (0%)RUS0 (-100%)TUR2 (0%)
CHN19 (0%)ITA4 (0%)SAU1 (-50%)UKR2 (0%)
COL5 (-29%)JPN17 (-15%)SEN1 (0%)ARE1 (-50%)
HRV5 (0%)KOR14 (-18%)SRB0 (-100%)GBR37 (-16%)
CZE2 (0%)MKD2 (0%)SGP4 (0%)USA112 (-16%)
DNK5 (-29%)MYS1 (0%)SVK1 (0%)URY1 (0%)
EGY1 (0%)MEX8 (0%)SVN2 (0%)VNM1 (0%)
SLV1 (0%)MMR1 (0%)ZAF4 (0%)  
FIN5 (-17%)NPL0 (-100%)    

If you have questions or comments, please leave them in the comments below.

Basic Authentication: End of an Era


1sep2022: Added announcement regarding Jan2023 extension

Back in September 2019, Microsoft announced it would start to turn off Basic Authentication for non-SMTP protocols in Exchange Online on tenants where the authentication protocol was detected as inactive. This is part of an overall movement to deprecate the less secure Basic Authentication, which is unfit to face the security challenges of the modern world, being subject to things like password spray attacks. It’s modern successor, modern authentication or OAuth2, uses a token and claim based mechanism contrary to sending accounts and passwords, and is the preferred authentication method. When combined with Azure AD for authentication, Modern Authentication also supports features such as Multi-Factor Authentication or Conditional Access.

The original date for disabling of Basic Authentication was October 13th, 2020. Then the world had other matters to deal with, and Microsoft extended the timelines. After initially postponing turning Basic Authentication off to second half of 2021, the ‘start date’ for permanently turning the lights off for Basic Authentication was set to October 1st, 2022, as per this article on Docs and MC286990 in the Message Center. Mind the ‘start’ in start date, as flicking the switch for millions of tenants takes time before it becomes effective on your tenant. Organizations do need to anticipate on this change for the first of October.

On September 1st, Microsoft published an update to these timelines as there were still some cases were organizations could not make the deadline of October 1st. To meet these customers “one last time”, organizations can now use the self-service diagnostics to extend disabling of Basic Authentication to January 2023. This needs to be done per protocol, also if organizations requested opt-out or re-enabled Basic Authentication earlier. Details as well as instructions and revised timelines on Basic Authentication switching off are laid out in a new article.

Until then, organizations can (re-)enable Basic Authentication for the protocols they need, using the self-help system in the Microsoft 365 admin center. After entering “Diag: Enable Basic Auth in EXO” in the problem search query, the request will be checked, and Basic Authentication will get enabled. But with the end of support for Basic Authentication, so will this temporary workaround. On a side note, per end of 2020, newly created tenants already have basic authentication disabled by means of security defaults – if those organizations require Basic Authentication for some reason, they will also need to reconfigure security defaults which by default is an all or nothing option for all protocols.

So, with the doomsday counter ticking away for Basic Authentication, what are the consequences for Exchange related workloads organizations might wonder. In this article, I will address some of these concerns.

Update: Microsoft meanwhile has disclosed much awaited details on changes in the native Mail app on iOS. This update is effective per iOS 15.6, and adds support for migrating configured accounts from using Basic Authentication to using Modern Authentication (OAuth). For this work work seamlessly and without user interruption, some configuration is needed on the back-end. Details can be found in a separate article here on this specific topic.

Click here to read the full article on ENow Solutions blog. Note that the ENow article does not include later updates, such as the latest timeline revisions and iOS account conversion, both mentioned above.

Annual Report 2021


stats chart

Happy new year to all my dear readers and followers. While some thought after 2020 things would improve soon, 2021 proved to be another year of dealing with measures. That said, 2021 was not very different compared to 2020 from a work perspective, with many organizations now professionalizing their quickly adopted digital transformation, further normalization for work from home scenarios. The year again proved to be a challenge for those busy working on customer projects while catering to the community as well. In the end, it is all about finding a balance, especially if you are working from home and the rest of the household is as well.

Now, without further ado, here are some of this blog’s and GitHub’s top entries for 2021.

General Stats

  • Number of views: 271,751 (3,086,610 all-time)
  • Unique visitors: 168,011 (1,627,860 all-time)
  • Number of posts: 17 (647 total)
  • Followers: 508
  • Busiest day: March 4, 2021 (5,616)
  • Popular time of day: Wednesday, 3pm

Popular blogs

Not surprisingly, posts related to the Hafnium security updates lead the way in 2021:

POPULAR Blogs from 2021
Security Update Exchange 2010-2019 (Mar2021)
Security Updates Exchange 2013-2019 (Jul2021)
Security Recommendation Exchange 2016-2019
Security Updates Exchange 2013-2019 (Nov2021)
Security Updates Exchange 2013-2019 (Oct2021)

While I published some additional scripts on my GitHub repository, some scripts like the script to download Ignite sessions or remove duplicate items from Exchange mailboxes remain popular. I performed a total of 144 updates on the scripts, and have 102 people following my GitHub profile.

Script
Connect-Office365Services
Get-EventSession
Remove-DuplicateItems
Remove-MessageClassItems
Invoke-Unarchive

Top Visitor Countries

Country
United States of America
Germany
United Kingdom
The Netherlands
India

MVPs around the World (2021)


A new Microsoft MVP award cycle, a new moment to have a look at the MVP statistics. Below numbers are taken from the public MVP site. While July 1st is the first day of the new award cycle, it usually is recommended to wait few days for the site and data behind it to get updated. and new and renewed awardees turning in their Non-Disclosure Agreement before showing up on the site. Because people get awarded every month, the comparison to July of every year should give an idea of the yearly trend.

Disclaimer: A percentage of MVP awardees are anonymous, and do not disclose information regarding expertise or location. There are currently 133 anonymous MVPs, and they are not taken into account in below statistics.

The following table contains the awardees per award category from July of 2019, 2020 and 2021, and change percentage compared to the year before. I will leave the interpretation up to you.

ExpertiseJul2019Jul2020%Jul2021%
Cloud and Datacenter Management232209-10%2195%
Microsoft Azure40946313%53415%
Office Apps & Services4915124%5569%
Business Applications16624045%32335%
Data Platform3323588%3929%
Developer Technologies6446978%77010%
Enterprise Mobility1061137%13318%
AI8412245%13813%
Office Development476436%698%
Windows Development119110-8%1209%
Windows and Devices for IT5743-25%42-2%
Total268729319%329612%
Count263428498%322313%

Note: The total number of MVPs doesn’t equal the total number of awardees, as MVPs can be awarded in more than one category. A total of 77 MVPs are awarded in two or more categories.

When zooming in on the Office Apps & Services category, the awards per country are shown below, including the % change compared to last year. As you might notice, there are quiet a number of new countries being represented: Ghana, Greece, Peru, Senegal and Vietnam. This supports the current Diversity & Inclusion mindset, and in my opinion is a good thing.

CountryNumberCountryNumberCountryNumberCountryNumber
AUS26 (8%)FRA22 (22%)NZL6 (0%)LKA1 (0%)
AUT3 (0%)DEU30 (25%)NGA3 (50%)SWE10 (11%)
BEL5 (0%)GHA1 (100%)NOR6 (0%)CHE3 (0%)
BIH1 (0%)GRC1 (100%)PAK1 (0%)TWN4 (0%)
BRA10 (25%)HUN2 (0%)PER1 (100%)THA2 (0%)
BGR3 (50%)IND12 (-8%)POL6 (0%)NLD22 (0%)
KHM1 (0%)IRL2 (100%)PRT3 (0%)TUR2 (0%)
CAN34 (3%)ISR3 (200%)RUS9 (0%)UKR2 (0%)
CHN17 (0%)ITA5 (0%)SAU1 (0%)ARE2 (100%)
COL6 (20%)JPN20 (0%)SEN1 (100%)GBR38 (15%)
HRV5 (0%)KOR14 (16%)SRB1 (0%)USA131 (6%)
CZE2 (0%)MKD2 (0%)SGP4 (33%)URY1 (0%)
DNK6 (0%)MYS1 (0%)SVK1 (0%)VNM1 (100%)
EGY1 (0%)MEX7 (40%)SVN2 (0%)
SLV1 (0%)MMR1 (0%)ZAF4 (0%)
FIN6 (50%)NPL1 (0%)ESP14 (16%)

And finally, the number of Office Apps & Services and total number of MVP’s over the last years.

OAS & Total PER CYCLEJul2017Jul2018Jul2019Jul2020Jul2021
Office Apps & Services MVPs449383491512535
% Change-15%28%4%4%
Total MVPs34903030263428493223
% Change-13%-13%8%13%

If you have questions or comments, please leave them in the comments below.

Annual Report 2020


stats chart

Happy new year to all my dear readers and followers. And what a crazy year 2020 has been, where the pandemic forced the hand of those delaying digital transformation. The uptake of work from home and supporting technologies and adoption was phenomenal, and professionally it has been an extremely busy year. As you can spend your time only once, the year again proved to be a challenge for those busy working on customer projects while tending to the community as well. In the end, it is all about finding a balance, especially if you are working from home and the rest of the household is as well. And then there’s this cat.

That said, I thought it would be nice to kick 2021 off with reinstating the annual report. I’d like to share with you some of blog’s statistics of 2020, the blog’s 10th year running. The statistics come directly from the site and without additional observations, apart from that for some reason looking things up related to Exchange 2010 still remains to be very popular.

General 2020 Stats

  • Number of views: 300,370 (2,811,923 all-time)
  • Unique visitors: 129,905 (1,457,892 all-time)
  • Number of posts: 20 (629 total)
  • Followers: 450
  • Busiest day: November 18th (3,496 views – Teams Custom Background referrals)
  • Most time: Wednesday, 4pm
  • Top post of 2020: Configuring Exchange Online with IMAP & OAuth2

Most popular blogs from 2020

Apart from the Versions, Builds and Dates, Schema Versions and Toolkit pages, the newly introduced Teams Custom Backgrounds page stood out this year with 13,117 in just a few months. When it comes to blogs published in 2020, the most viewed posts are:

Blog from 2020
Configuring Exchange Online with IMAP & OAuth2
Exchange Online Management using EXOv2 module
Outlook Connectivity changes per Nov2021
Security Updates Exchange 2010-2019 (Dec2020)
Holiday Season Teams background

Most popular all-time blogs

BLOG (All-Time)
Limiting Exchange 2010 Database Cache /
Limiting Exchange 2010 SP1 Database Cache
Exchange ActiveSync and Inheritable Permissions issue
TargetAddress, ExternalEmailAddress and Set As External
The Attribute, the Myth, the legacyExchangeDN
Exchange Message Size Limits

Top Scripts in 2020 (GitHub)

Script
Connect-Office365Services
Get-EventSession
Remove-DuplicateItems
Install-Exchange15
Remove-MessageClassItems

Top visitor countries in 2020

Country
United States
United Kingdom
Germany
Netherlands
Canada

Top referrers in 2020

Referer
Google
Bing
Spiceworks (community)
Twitter
Practical365 (blog)

Most used search terms in 2020

Search term(s)
exchange versions
exchange 2010 end of life
exchange schema versions
office 2016 support lifecycle
exchange version 15.1